VCL Chart Crosshair Cursor
- 4 minutes to read
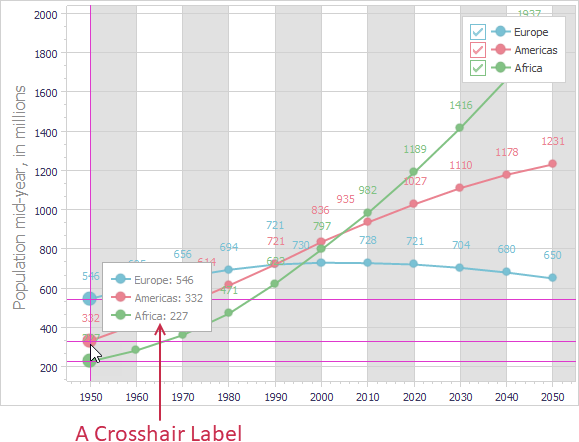
Crosshair Cursor is an advanced tooltip that targets one or multiple series points in an XY diagram and displays additional information on them in a label similar to a diagram legend pane.
In addition, you can display crosshair lines and axis labels to help users track the coordinates of target points or the current mouse pointer position. You can hide or display all Crosshair Cursor elements in any combination as well as customize their appearance and behavior.
Enable Crosshair Cursor
Only XY diagrams support Crosshair Cursor. To enable this functionality for all XY diagrams in a Chart control, set the control’s ToolTips.DefaultMode property to TdxChartToolTipMode.Crosshair.
Alternatively, you can set an individual XY diagram’s ToolTips.Mode property to TdxChartToolTipMode.Crosshair to enable Crosshair Cursor for the diagram regardless of the parent Chart control’s ToolTips.DefaultMode property value.
Individual Series Settings
You can set the ToolTips.Enabled property of an individual series to False to exclude points of the series from possible Crosshair Cursor targets.
Crosshair Cursor Navigation
Crosshair Cursor can target one or multiple series points depending on the current mouse pointer position, nearest series point positions, and the following crosshair cursor navigation settings accessible through the Chart control’s ToolTips.CrosshairOptions property:
- SnapToOutRangePoints
- Specifies if Crosshair Cursor can target series points outside the currently visible axis ranges.
- SnapToPointMode
- Specifies how the Chart control detects target series points for Crosshair Cursor.
- SnapToSeriesMode
- Specifies how the Chart control chooses target series for Crosshair Cursor.
Crosshair Cursor Elements
Crosshair Cursor consists of a main label, crosshair lines, and axis labels. General crosshair element appearance and behavior settings are accessible through the Chart control’s ToolTips.CrosshairOptions property. These settings affect all visible XY diagrams in the same Chart control.
Main Crosshair Label
A main crosshair label displays information on target series points including a series caption, value, and the corresponding glyph displayed in a legend pane.
Main Label Visibility
Use the Labels.Visible property to hide or display the main crosshair label.
Main Label Appearance
You can use the Labels.Appearance property set to adjust the label layout, configure background fill settings, change font size and typeface, and hide or customize label borders.
Refer to the TdxChartCrosshairLabelAppearance class description for detailed information on all available options.
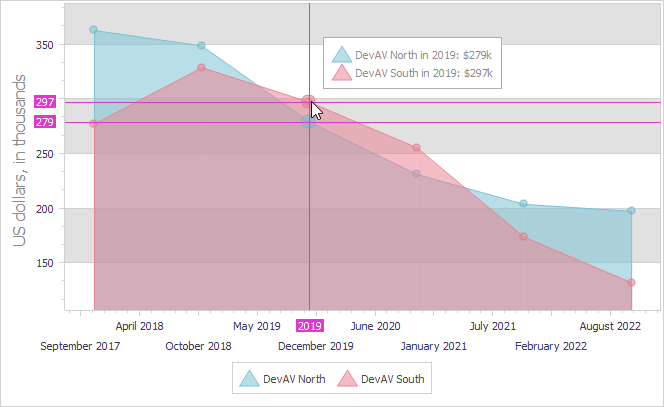
Main Label Formatting
The main crosshair label can use series point tooltip formatting patterns defined at the diagram or series level. A custom formatting pattern is useful when you need to display a date or time value in the crosshair label, add measurement units, or display additional information.

The following code example defines a custom formatting pattern for series point tooltips at the diagram level in a Chart control with one XY diagram and two simple Area series:
var
  AXYDiagram: TdxChartXYDiagram;
begin
  AXYDiagram := dxChartControl1.Diagrams[0] as TdxChartXYDiagram;
  AXYDiagram.ToolTips.Mode := TdxChartToolTipMode.Crosshair;  // Enables Crosshair Cursor
  AXYDiagram.ToolTips.PointToolTipFormat := '{S} in {A:yyyy}: ${V}k';
end;
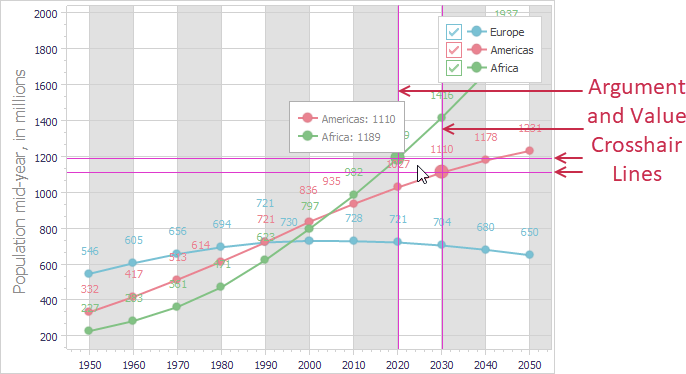
Crosshair Lines
Argument and value crosshair lines denote target arguments and values in an XY diagram.
Line Visibility
Use ArgumentLines.Visible and ValueLines.Visible properties to independently hide or display crosshair argument and value lines.
Line Appearance
Use ArgumentLines.Appearance and ValueLines.Appearance properties to independently configure style, thickness, and color of argument and value crosshair lines.
Axis Labels
Crosshair argument and value axis labels complement crosshair lines and display arguments and values that correspond to crosshair line positions within the XY diagram area.
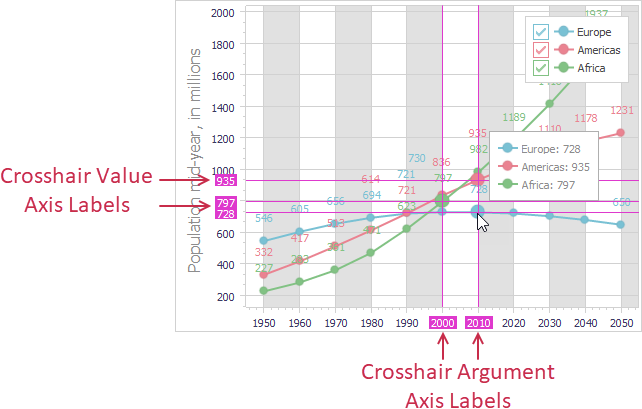
Axis Label Visibility
Use ShowArgumentLabels and ShowValueLabels properties to independently hide or display crosshair argument and value axis labels.
Axis Label Appearance
Axis label appearance settings are accessible through the CrosshairLabels property of axes of arguments and values in an XY diagram. You can use this property to independently customize font and background fill settings for crosshair argument and value axis labels.
Refer to the TdxChartCrosshairAxisLabels class description for detailed information on all available options.
Custom Axis Label Formatting
A custom formatting pattern is particularly useful for crosshair axis labels that correspond to crosshair lines that follow the mouse pointer freely rather than snap to series points because axis labels display coordinates without decimal place limitations.
The following code example defines custom patterns for argument and value axis labels in a Chart control with one XY diagram:
var
  AXYDiagram: TdxChartXYDiagram;
begin
  AXYDiagram := dxChartControl1.Diagrams[0] as TdxChartXYDiagram;
  AXYDiagram.Axes.AxisX.CrosshairLabels.TextFormat := '{A:yyyy mmmm}';  // A custom date format
  AXYDiagram.Axes.AxisY.CrosshairLabels.TextFormat := '${V:0.00}k';  // A custom numeric format
end;
Limitations
Simple diagrams do not support the Crosshair Cursor mode because it is designed for use in a two-dimensional Cartesian coordinate system.