Indicators
- 4 minutes to read
Indicators are special metrics that are commonly used to analyze and process series data visually. This topic lists the indicators the Chart control provides, and explains how to add an indicator to a series.

Note
Note that you can only plot indicators with XY-Diagram series.
This document consists of the following sections.
- Available Indicators
- Add an Indicator to a Series
- Plot an Indicator on a Separate Pane
- Display Indicator Point Values using the Crosshair Cursor
- Customize Indicator Appearance
Available Indicators
The following list includes which indicators the Chart control provides.
-
- Fibonacci Arcs
- Fibonacci Fans
- Fibonacci Retracement
-
- ExponentialMovingAverage (EMA)
- SimpleMovingAverage (SMA)
- TriangularMovingAverage (TMA)
- TripleExponentialMovingAverageTema (TEMA)
- WeightedMovingAverage (WMA)
-
- AverageTrueRange (ATR)
- ChaikinsVolatility (CHV)
- CommodityChannelIndex (CCI)
- DetrendedPriceOscillator (DPO)
- MovingAverageConvergenceDivergence (MACD)
- RateOfChange (RoC)
- RelativeStrengthIndex (RSI)
- TripleExponentialMovingAverageTrix (TRIX)
- WilliamsR (Williams %R)
Add an Indicator to a Series
At Design Time
Select a series in the Properties window. Expand the SeriesBase.View property and click the XYDiagram2DSeriesViewBase.Indicators property’s ellipsis button. Click the Add… button in the invoked Indicator Collection Editor.
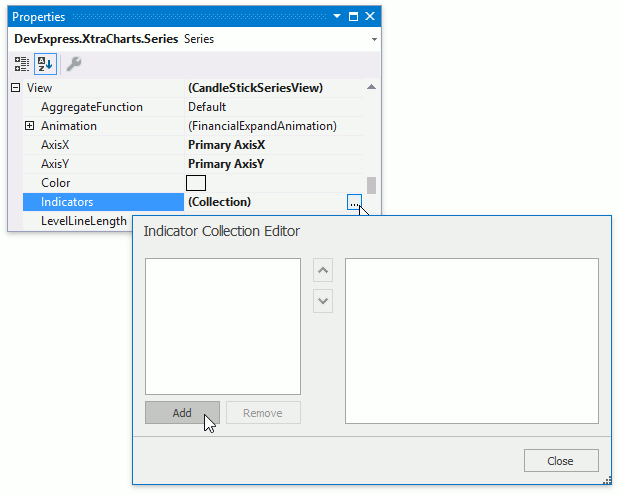
In the Indicator Type dialog, select an indicator and click OK.

In Code
The following code adds the Rate of Change indicator to a series view.
CandleStickSeriesView seriesView { get { return series.View as CandleStickSeriesView; } }
// ...
RateOfChange indicator = new RateOfChange();
indicator.PointsCount = 14;
indicator.ValueLevel = ValueLevel.Close;

indicator.ShowInLegend = true;
indicator.LegendText = "RoC (14)";
indicator.Legend = chartControl.Legends["IndicatorLegend"];

seriesView.Indicators.Add(indicator);
The following table lists the API members used by code above.
| Member | Description |
|---|---|
| XYDiagram2DSeriesViewBase.Indicators | The series view’s collection of indicators. |
| IndicatorCollection.Add | Adds an indicator to the end of a collection. |
| Indicator.ShowInLegend | Specifies whether to display the indicator in the legend. |
| Indicator.LegendText | Gets or sets the text that identifies the indicator in the legend. |
| Indicator.Legend | Specifies the legend that displays the indicator. The default legend is used if this property is not specified. |
Plot Indicator in a Separate Pane
The SeparatePaneIndicator descendants can be plotted on a separate pane with a secondary axis. Below is the list of these indicators.
- AverageTrueRange
- ChaikinsVolatility
- CommodityChannelIndex
- DetrendedPriceOscillator
- MassIndex
- MovingAverageConvergenceDivergence
- RateOfChange
- RelativeStrengthIndex
- StandardDeviation
- TripleExponentialMovingAverageTrix
- WilliamsR
The following image shows the Rate of Change indicator in a separate pane.

The following code assigns a pane and secondary y-axis to an indicator.
diagram.Panes.Add(new XYDiagramPane("IndicatorPane"));
diagram.SecondaryAxesY.Add(new SecondaryAxisY("IndicatorYAxis"));

indicator.Pane = diagram.Panes["IndicatorPane"];
indicator.AxisY = diagram.SecondaryAxesY["IndicatorYAxis"];
The code above uses the following API members.
| Member | Description |
|---|---|
| SeparatePaneIndicator.Pane | Gets or sets the pane that contain the indicator. |
| SeparatePaneIndicator.AxisY | Gets or sets the y-axis the indicator uses. |
Display Indicator Point Values using the Crosshair Cursor
You can use the Crosshair Cursor to display indicator point values in the Crosshair’s label or in a legend:
| Label | Legend |
|---|---|
 |
 |
The following code enables the Crosshair for an indicator.
indicator.CrosshairEnabled = DevExpress.Utils.DefaultBoolean.True;
indicator.CrosshairLabelPattern = "Rate of Change:" + Environment.NewLine + "{V:n3} ({A:MMMM dd})";
indicator.CrosshairContentShowMode = CrosshairContentShowMode.Label;
The code uses the following API members.
| Member | Description |
|---|---|
| Indicator.CrosshairEnabled | Specifies whether the Crosshair Cursor is shown when the mouse cursor hovers over the indicator. |
| Indicator.CrosshairLabelPattern | Gets or sets the string that formats the text that the Crosshair Cursor shows for the indicator’s point. |
| Indicator.CrosshairContentShowMode | Gets or sets the element that displays the indicator’s Crosshair content. |
| CrosshairContentShowMode | Lists elements the Crosshair Cursor can use to show content. |
Customize Indicator Appearance
You can change an indicator’s color and specify an indicator line style.

Use the following code to configure indicator appearance as in the image above.
indicator.LineStyle.DashStyle = DashStyle.Dash;
indicator.LineStyle.Thickness = 2;
// Specify an individual indicator's color.
indicator.Color = Color.Orange;
// Or apply a palette.
// chartControl.IndicatorsPaletteName = "Urban";
The following table lists the API members used by code above.
| Member | Description |
|---|---|
| Indicator.LineStyle | Specifies the indicator‘s line style settings. |
| LineStyle.DashStyle | Gets or sets the dash style used to paint the line. |
| LineStyle.Thickness | Gets or sets the line’s thickness. |
| Indicator.Color | Specifies the indicator‘s color. |
| ChartControl.IndicatorsPaletteName | Specifies the palette that is used to paint all indicators that exist in a chart control. |