Histogram
- 7 minutes to read
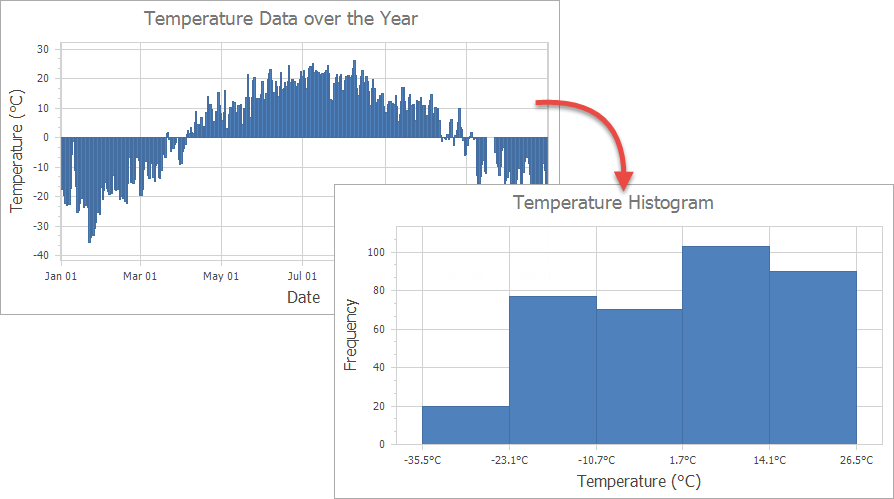
This topic explains how to fine-tune the Chart Control’s axis and series settings to make a histogram.
Required Steps
Optional Steps
- Specify Side Bin Thresholds
- Specify Bar Width
- Configure the Grid and Label Layout
- Customize Axis Label Text
Specify a Data Source
There are two key differences in how you provide histogram data to a chart:
Define a data source field that provides series arguments. You never have to supply data for series values. The Chart Control calculates values as aggregates based on the frequency of arguments.
You can use a one-dimensional array as a data source. In this case, you do not have to specify an argument’s data member.
You can use the following API:
| Member | Description |
|---|---|
| ChartControl.DataSource (Series.DataSource) | Specifies the chart control (series) data source. |
| SeriesBase.ArgumentDataMember | Gets or sets the name of the data field that contains series point arguments. |
private void Form1_Load(object sender, EventArgs e) {
    chartControl1.DataSource = LoadDataTableFromXml("..\\..\\Data\\CityWeather.xml", "CityWeather");
    Series series = new Series();
    series.ArgumentDataMember = "Temperature";
    chartControl1.Series.Add(series);
}
static DataTable LoadDataTableFromXml(string fileName, string tableName) {
    DataSet xmlDataSet = new DataSet();
    xmlDataSet.ReadXml(fileName);
    return xmlDataSet.Tables[tableName];
}
The data structure looks as follows:
<?xml version="1.0"?>
<ArrayOfCityWeather xmlns:xsi="http://www.w3.org/2001/XMLSchema-instance"
                    xmlns:xsd="http://www.w3.org/2001/XMLSchema">
  <xs:schema xmlns:xs="http://www.w3.org/2001/XMLSchema">
    <xs:element name="CityWeather">
      <xs:complexType>
        <xs:sequence>
          <xs:element name="Date" type="xs:dateTime"/>
          <xs:element name="Temperature" type="xs:double"/>
        </xs:sequence>
      </xs:complexType>
    </xs:element>
  </xs:schema>
  <CityWeather>
    <Date>2018-01-01T00:00:00</Date>
    <Temperature>-17.5</Temperature>
  </CityWeather>
  <CityWeather>
    <Date>2018-01-02T00:00:00</Date>
    <Temperature>-16.3</Temperature>
  </CityWeather>
  <!--...-->
</ArrayOfCityWeather>
Aggregate Data and Divide an Axis Scale into Intervals
- To aggregate data points into histogram bins, set the ScaleGridOptionsBase.AggregateFunction property to Histogram.
- Set the ScaleOptionsBase.ScaleMode property to Interval to make the x-axis divide its scale into intervals.
private void Form1_Load(object sender, EventArgs e) {
    //...
    XYDiagram diagram = chartControl1.Diagram as XYDiagram;
    diagram.AxisX.NumericScaleOptions.AggregateFunction = AggregateFunction.Histogram;
    diagram.AxisX.NumericScaleOptions.ScaleMode = ScaleMode.Interval;
}
The Chart Control applies Scott’s Normal Reference Rule (NumericIntervalOptions.DivisionMode is Auto) to compute an optimal number of bins. If necessary, you can define the number of bins or the bin size.
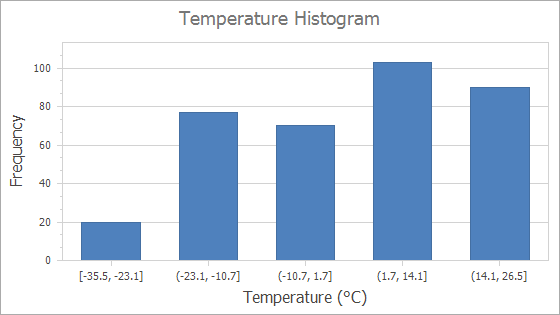
Specify the Number of Bins
The Chart Control can display a given number of bins. The bin value range is automatically calculated.
private void Form1_Load(object sender, EventArgs e) {
    XYDiagram diagram = chartControl1.Diagram as XYDiagram;
    //...
    diagram.AxisX.NumericScaleOptions.IntervalOptions.DivisionMode = IntervalDivisionMode.Count;
    diagram.AxisX.NumericScaleOptions.IntervalOptions.Count = 5;
}
The following table lists the API members used in the code above:
| Member | Description |
|---|---|
| NumericScaleOptions.IntervalOptions | Stores options for numeric axis when its ScaleMode is Interval. |
| NumericIntervalOptions.DivisionMode | Specifies how to divide axis scale into intervals. |
| IntervalDivisionMode | Lists values that define the axis interval calculation method. |
| NumericIntervalOptions.Count | Gets or sets the number of intervals when DivisionMode is Count. |
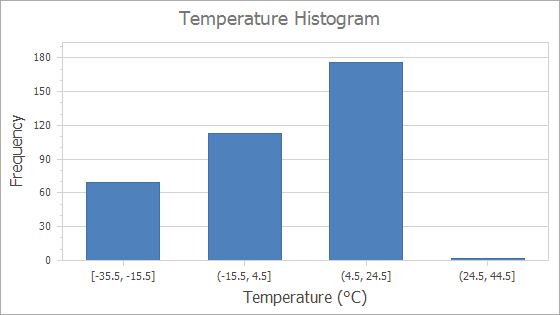
Specify the Bin Size
You can specify a value range that intervals display. The number of bins is calculated automatically.
private void Form1_Load(object sender, EventArgs e) {
    XYDiagram diagram = chartControl1.Diagram as XYDiagram;
    //...
    diagram.AxisX.NumericScaleOptions.IntervalOptions.DivisionMode = IntervalDivisionMode.Width;
    diagram.AxisX.NumericScaleOptions.IntervalOptions.Width = 20;
}
The following table lists the API members used in the code above:
| Member | Description |
|---|---|
| NumericScaleOptions.IntervalOptions | Stores options for numeric axis when its ScaleMode is Interval. |
| NumericIntervalOptions.DivisionMode | Specifies how to divide axis scale into intervals. |
| IntervalDivisionMode | Lists values that define the axis interval calculation method. |
| NumericIntervalOptions.Width | Gets or sets the interval size when DivisionMode is Width. |
Specify Side Bin Thresholds
You can change thresholds for underflow and overflow bins:

The following code uses the NumericIntervalOptions.UnderflowValue and NumericIntervalOptions.OverflowValue properties to change thresholds.
private void Form1_Load(object sender, EventArgs e) {
    XYDiagram diagram = chartControl1.Diagram as XYDiagram;
    //...
    diagram.AxisX.NumericScaleOptions.IntervalOptions.OverflowValue = 20;
    diagram.AxisX.NumericScaleOptions.IntervalOptions.UnderflowValue = -30;
}
Note
Use DateTimeIntervalOptions.UnderflowValue and DateTimeIntervalOptions.OverflowValue for date-time axes.
Specify Bar Width
A histogram usually uses bars positioned next to each other without gaps to display histogram bins.
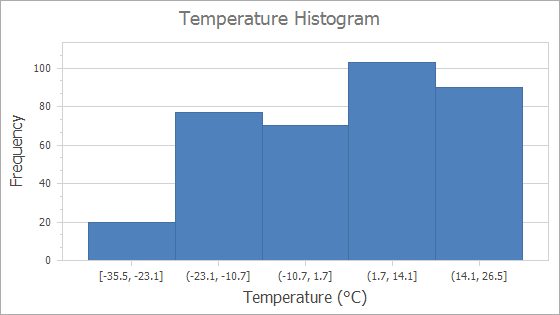
Set the BarSeriesView.BarWidth property to 1 to remove gaps between bars.
private void Form1_Load(object sender, EventArgs e) {
    Series series = new Series();
    //...
    SideBySideBarSeriesView view = series.View as SideBySideBarSeriesView;
    view.BarWidth = 1;
    //...
    chartControl1.Series.Add(series);
}
Configure the Grid and Label Layout
The Chart Control aligns axis labels, major grid lines, and major tick marks to the center of each bin. You can choose to align them to the beginning of each interval instead.
Specify the GridLayoutMode (NumericIntervalOptions.GridLayoutMode, DateTimeScaleOptions.GridLayoutMode or QualitativeScaleOptions.GridLayoutMode) property to change the axis label, grid line, or tick mark alignment.
private void Form1_Load(object sender, EventArgs e) {
    XYDiagram diagram = chartControl1.Diagram as XYDiagram;
    //...
    diagram.AxisX.NumericScaleOptions.IntervalOptions.GridLayoutMode = GridLayoutMode.GridAndLabelShifted;
    diagram.AxisX.GridLines.Visible = true;
}
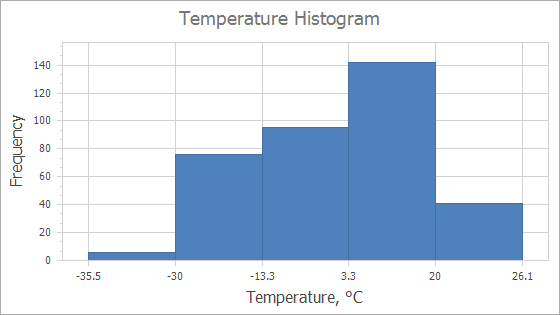
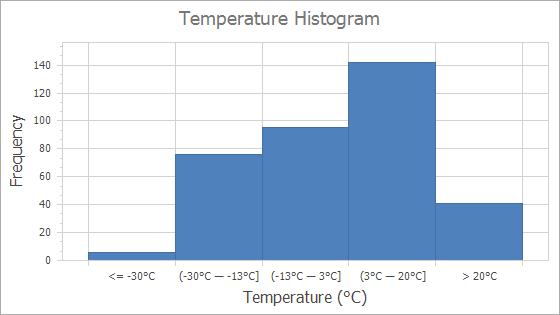
Customize Axis Label Text
You can format label text for axis scale intervals and the underflow/overflow bins.
private void Form1_Load(object sender, EventArgs e) {
    XYDiagram diagram = chartControl1.Diagram as XYDiagram;
    //...
    diagram.AxisX.NumericScaleOptions.IntervalOptions.Pattern = "{OB}{A1:F0}°C ― {A2:F0}°C{CB}";
    diagram.AxisX.NumericScaleOptions.IntervalOptions.UnderflowValuePattern = "{US} {A2}°C";
    diagram.AxisX.NumericScaleOptions.IntervalOptions.OverflowValuePattern = "{OS} {A1}°C";
}
The following table lists the API members the code above uses:
| Member | Description |
|---|---|
| IntervalOptionsBase.Pattern | Gets or sets a format string that configures text for the interval axis labels and crosshair labels. |
| IntervalOptionsBase.UnderflowValuePattern | Gets or sets a format string that configures text for the underflow interval axis labels and crosshair labels. |
| IntervalOptionsBase.OverflowValuePattern | Gets or sets a format string that configures text for the overflow interval axis labels and crosshair labels. |
Patterns can contain regular text (displayed as is) and value placeholders in braces. To format numeric and date/time values, you can apply Format Specifiers. Use a colon to separate a placeholder and its format specifier.
The following table contains the available placeholders:
| Placeholder | Description |
|---|---|
| {OB} | Displays an opening bracket. |
| {CB} | Displays a closing bracket. |
| {OS} | Displays the greater than sign. |
| {US} | Displays the less than or less than or equal to sign. |
| {A1} | Displays the interval start value. |
| {A2} | Displays the interval end value. |
Note
Use the AxisLabel.TextPattern property to format label text when the GridLayoutMode (NumericIntervalOptions.GridLayoutMode, DateTimeScaleOptions.GridLayoutMode or QualitativeScaleOptions.GridLayoutMode) property is set to GridAndLabelShifted.