Best Practices: Display Large Data
- 9 minutes to read
A chart’s performance directly relates to how many points and elements it displays: fewer elements result in higher performance. This topic explains how to reduce the number of data points and enhance the chart’s performance.
Load Data
The following approaches can help you to accelerate loading data:
Store all data points in as few series as possible. The Chart control is optimized to render a small number of series that have many points, rather than a large number of series with a few points. For example, a single series with a million points is processed faster than 10 series with 100000 points each.
Use data adapters to load data to the chart.
You can automatically create series based on a template at chart level. To do this, initialize the SeriesTemplate.DataAdapter property with one of the following objects:
To populate a manually created series with data, initialize the Series.DataAdapter property with one of the following objects:
If the data schema of the underlying chart source is known, create an adapter that loads data to the chart. The adapter implemented specifically for your data source allows you to avoid the overhead of the Reflection API and type boxing operations. To create a data adapter, create a class that implements ISeriesAdapter or ISeriesTemplateAdapter.
For example, the chart’s data source is a collection of the following objects:
public class DataItem { public double Argument { get; } public double Value { get; } public DataItem(double argument, double value) { Argument = argument; Value = value; } }The data adapter that loads DataItem objects may look as follows:
public class CustomNumericDataAdapter : ISeriesAdapter {
    readonly IList<DataItem> items;
    public bool DataSorted => true;
    public int ItemsCount => this.items.Count;
    public CustomNumericDataAdapter(IList<DataItem> items) {
        this.items = items;
    }
    event NotifyChartDataChangedEventHandler IChartDataAdapter.DataChanged {
        add { }
        remove { }
    }
    public object Clone() {
        return this;
    }
    public double GetNumericalValue(int index, ChartDataMemberType dataMember) {
        switch (dataMember) {
            case ChartDataMemberType.Argument: return items[index].Argument;
            case ChartDataMemberType.Value: return items[index].Value;
        }
        return double.NaN;
    }
    public object GetSourceObject(int index) {
        return this.items[index];
    }
    public ActualScaleType GetScaleType(ChartDataMemberType dataMember) {
        return ActualScaleType.Numerical;
    }
    public DateTime GetDateTimeValue(int index, ChartDataMemberType dataMember) {
        throw new NotImplementedException();
    }
    public string GetQualitativeValue(int index, ChartDataMemberType dataMember) {
        throw new NotImplementedException();
    }
    public TimeSpan GetTimeSpanValue(int index, ChartDataMemberType dataMember) {
        throw new NotImplementedException();
    }
    public object GetObjectValue(int index, ChartDataMemberType dataMember) {
        throw new NotImplementedException();
    }
}
Enable the DataSourceAdapterBase.DataSorted or SeriesBase.DataSorted property to notify the chart or series that its data source is already sorted to prevent the chart’s internal sorting procedures.
Starting with v16.1, the Chart Control loads data and applies settings when a chart is being rendered. This means you do not have to use the ChartControl.BeginInit and ChartControl.EndInit methods, or the SeriesPointCollection‘s ChartCollectionBase.BeginUpdate and ChartCollectionBase.EndUpdate methods to accelerate loading data.
Data Aggregation
You can use the Data Aggregation functionality to configure a more compact and readable view for a large amount of data. When using data aggregation, the chart splits the x-axis into intervals (according to the measurement unit value), and automatically aggregates data for each interval using an aggregation function. The following images illustrate this feature:
| Non-aggregated data | Data aggregated by year |
|---|---|
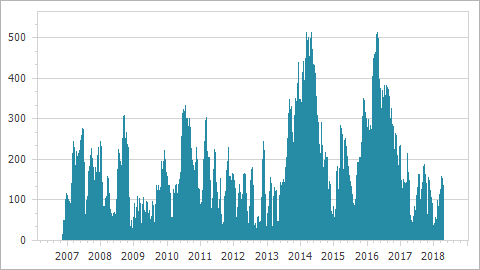 |
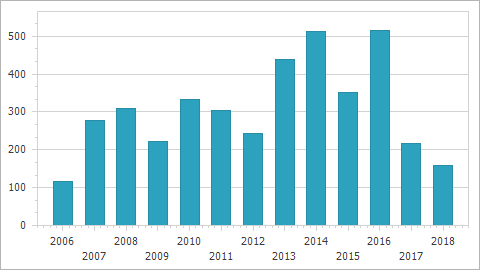 |
Refer to the following help topic for more details: Data Aggregation.
Automatic Resampling
An internal data resampling algorithm allows the chart to avoid unnecessary operations when rendering series. The chart renders the minimum set of points required to display the correct series shape and form. The algorithm discards all points that have no effect on the output (for example, overlapped points). Every time the zoom level or visible data range changes, the chart re-calculates the minimum point set.
The resampling algorithm is in effect under the following conditions:
- The Chart or series is bound to data. For more information, see the ChartControl.DataSource and Series.DataSource properties.
- The data source contains more than ten thousand data points.
- The series’s AllowResample property is set to true. Alternatively, you can use the ResamplingDataAdapter to resample series.
- The series has numeric values, and its numeric, DateTime or TimeSpan arguments are sorted in ascending order. Note that series with qualitative arguments are not resampled.
The resampled data algorithm and aggregated data display technique optimize RAM usage, but aggregate calculations require additional time and the resulting series shape can be different from the original.
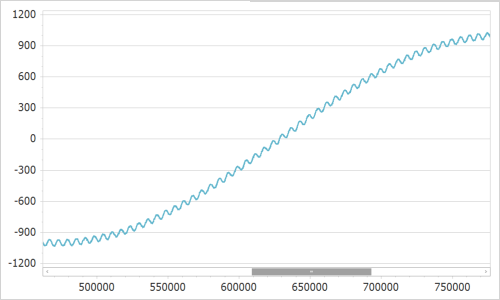
The series is resampled.
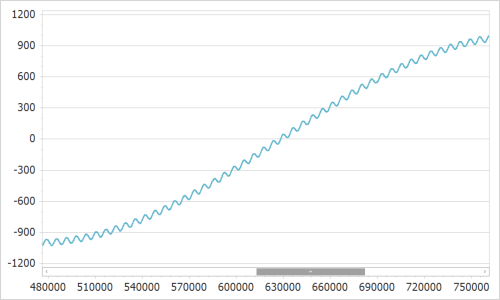
The raw series (The series is not simplified and resampled).
The series is plotted based on aggregated data.
Note that the resampling algorithm is not supported for the following series views:
- PieSeriesView
- DoughnutSeriesView
- NestedDoughnutSeriesView
- FunnelSeriesView
- PointSeriesView
- BubbleSeriesView
- ScatterLineSeriesView
- PolarPointSeriesView
- ScatterPolarLineSeriesView
- RadarPointSeriesView
- ScatterRadarLineSeriesView
- Pie3DSeriesView
- Doughnut3DSeriesView
- Funnel3DSeriesView
- BoxPlotSeriesView
Automatic Calculations
Range, scale type and layout’s automatic calculations require additional resources. The following steps can help accelerate rendering a chart:
- If the points’ argument and value range are known, manually define an AxisBase.WholeRange‘s limits for x- and y-axes using the Range.SetMinMaxValues method. Refer to the Visual Ranges and Whole Ranges document for more information on axis ranges.
- Set the ChartControl.AutoLayout property to false.
- If possible, define a scale type for series point arguments. For this, set the SeriesBase.ArgumentScaleType property to the ScaleType.Numerical, ScaleType.DateTime or ScaleType.Qualitative value depending on your data type. When ScaleType.Auto is used, a chart should perform additional calculations to determine the actual scale type. Note that a chart maximizes performance when it has the Numerical argument axis scale type. However, the Date-Time scale type does not suffer from significant performance degradation. In comparison, the Qualitative scale type requires more resources to process data values.
Rendering Visual Elements
Follow the steps below to decrease the time needed to render a chart’s visual elements:
- Leave the ChartControl.RefreshDataOnRepaint property value as false to prevent a chart from reloading all its data when it is redrawn.
- Using the ChartControl.CustomDrawSeriesPoint event functionality requires additional resources. Place points that should be customized into a separate series to improve performance.
- Set the ChartControl.CacheToMemory property to true. This prevents a chart from executing unnecessary redraw operations.
- The best series views to represent a large amount of data are the SwiftPlotSeriesView and SwiftPointSeriesView. The Swift Plot and Swift Point series views lack some elements and features available for other view types. These limitations allow these views to achieve the best possible performance. Refer to the following help topic for more information: Swift Plot Diagram.
- Use a single color to paint series points instead of applying the SeriesViewColorEachSupportBase.ColorEach property.
- Also note that each additional chart element (for example, a series point label) requires extra rendering time. This also applies to visual effects such as chart elements’ Shadow.
The data point markers should be invisible when you use the LineSeriesView and its descendants. Also, modify the LineSeriesView.LineStyle property’s line style settings as follows:
- Set the LineStyle.DashStyle property to DashStyle.Solid.
- Define the LineStyle.Thickness property as 1 or 2.
- Assign the LineJoin.Bevel (System.Drawing.Drawing2D) value to the LineStyle.DXLineJoin property.
- Change the LineSeriesView.EnableAntialiasing property to false.
When you are dealing with the Point Series View or Bubble Series View, change their data point marker options as demonstrated below:
- Set the MarkerBase.Kind property to MarkerKind.Square.
- Change the MarkerBase.BorderVisible property to false.
- Set the MarkerBase.FillStyle property to FillMode.Solid.
- Use small values to define the SimpleMarker.Size property.
Customize the following parameters to optimize the Bar Series Views:
- Set the SideBySideBarSeriesView.EqualBarWidth property to true.
- Specify the BarSeriesView.FillStyle‘s FillStyle2D.FillMode as FillMode.Solid.
- Use the BorderBase.Visibility property to hide the BarSeriesView.Border.
Interactivity Optimization
The runtime hit testing, selection and tooltips features require additional CPU and RAM resources and may decrease performance.
- The ChartControl.RuntimeHitTesting property is set to false (default). Leave this option disabled unless it is required.
- The ChartControl.SelectionMode property is set to None (default). Leave this option disabled unless it is required.
- Use the Crosshair Cursor functionality instead of the Tooltip.
Changeable Data
This section contains tips that allow you to increase performance when a chart shows a dataset that changes frequently.
- Remove an existing point and add a new one instead to update the chart’s data. Changing an existing SeriesPoint‘s argument or value results in unnecessary calculations. For example, if you change the SeriesPoint.Values property, it calls the ChartControl.RefreshData method and updates the chart’s data.
Since v17.1, the Chart Control completely processes the following event arguments to avoid reloading all the data when the chart is bound to a dataset that updates frequently:
- ListChangedEventArgs - obtained on the IBindingList.ListChanged;
- System.Collections.Specialized.NotifyCollectionChangedEventArgs - received on the INotifyCollectionChanged.CollectionChanged.
For this reason, use the IBindingList objects to process data efficiently when a chart frequently updates data.