Swift Plot Diagram
- 4 minutes to read
This document details the specifics of the Swift Plot diagram type. It describes its purpose and specifics. Before reading this text, you may wish to review the basics of using a diagram in the WinForms Chart Control.
Swift Plot Overview
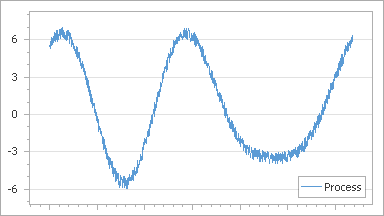
The SwiftPlotDiagram object is intended to plot series of the SwiftPlotSeriesView and SwiftPointSeriesView types. The main purpose of this diagram type is to construct real-time charts in which points are added in a short period of time, and/or charts with a large number of points (tens of thousands and more). To meet these requirements, this diagram type is built upon a special optimized algorithm, with its core being lightened as much as possible, to achieve the best performance.
Note that both this diagram and the corresponding series view type still support most features available for other 2D chart types: such as multiple panes, secondary axes, financial indicators and regression lines. So, in most aspects, this diagram type is similar to the XY-Diagram type.
Accessing a Diagram
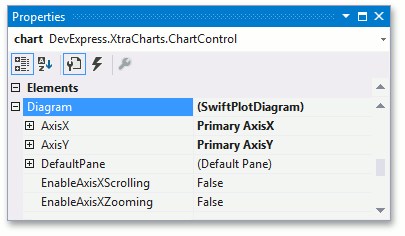
To access the Swift Plot Diagram’s options at design time, click your chart’s diagram, to select it. Then, in the Properties window, the Swift Plot Diagram’s properties will be represented.
This example demonstrates how to create a real-time chart (which is updated in a very short period of time), based on the Swift Plot.
Note that this series view type is associated with the Swift Plot Diagram type, and you should cast your diagram object to this type, in order to access its specific options.
using System;
using System.Windows.Forms;
using DevExpress.XtraCharts;
// ...

const int interval = 20;
Random random = new Random();
int TimeInterval = 10;
double value1 = 10.0;

AxisRange AxisXRange {
    get {
        SwiftPlotDiagram diagram = chartControl1.Diagram as SwiftPlotDiagram;
        if (diagram != null)
            return diagram.AxisX.Range;
        return null;
    }
}

double CalculateNextValue(double value) {
    return value + (random.NextDouble() * 10.0 - 5.0);
}

void UpdateValues() {
    value1 = CalculateNextValue(value1);
}

private void timer1_Tick(object sender, EventArgs e) {
    Series series1 = chartControl1.Series[0];

    if (series1 == null)
        return;
    DateTime argument = DateTime.Now;
    SeriesPoint[] pointsToUpdate1 = new SeriesPoint[interval];
    for (int i = 0; i < interval; i++) {
        pointsToUpdate1[i] = new SeriesPoint(argument, value1);
        argument = argument.AddMilliseconds(1);
        UpdateValues();
    }
    DateTime minDate = argument.AddSeconds(-TimeInterval);
    int pointsToRemoveCount = 0;
    foreach (SeriesPoint point in series1.Points)
        if (point.DateTimeArgument < minDate)
            pointsToRemoveCount++;
    if (pointsToRemoveCount < series1.Points.Count)
        pointsToRemoveCount--;
    series1.Points.AddRange(pointsToUpdate1);
    if (pointsToRemoveCount > 0) {
        series1.Points.RemoveRange(0, pointsToRemoveCount);
    }
    if (AxisXRange != null) {
        AxisXRange.SetMinMaxValues(minDate, argument);
    }
}