How to: Create a Real-Time Chart
- 6 minutes to read
This topic explains how to create a chart and add new points to its data source in real time.
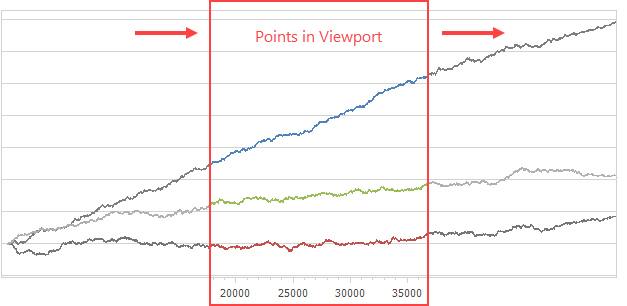
The chart processes points that are within its viewport. In the following examples, points that are beyond the viewport are removed from the data source - starting from the beginning of the collection.
Use a Single Thread to Create a Real-Time Chart
The following code generates a new data point that is added to the chart each time the Timer.Tick event occurs (every 100 milliseconds). The example uses an ObservableCollection as the data source for a series. ObservableCollection notifies the chart about new items, and the chart is rendered again.
using DevExpress.Utils;
using DevExpress.XtraCharts;
using System;
using System.Collections.ObjectModel;
using System.Windows.Forms;

namespace RealTimeChartUpdates {
    public partial class Form1 : Form {
        const int ViewportPointCount = 100;
        ObservableCollection<DataPoint> dataPoints = new ObservableCollection<DataPoint>();
        public Form1() { InitializeComponent(); }

        void Form1_Load(object sender, EventArgs e) {
            chartControl1.Titles.Add(new ChartTitle { Text = "Real-Time Charting" });

            Series series = new Series();
            series.ChangeView(ViewType.Line);
            series.DataSource = dataPoints;
            series.DataSourceSorted = true;
            series.ArgumentDataMember = "Argument";
            series.ValueDataMembers.AddRange("Value");
            chartControl1.Series.Add(series);

            LineSeriesView seriesView = (LineSeriesView)series.View;
            seriesView.LastPoint.LabelDisplayMode = SidePointDisplayMode.DiagramEdge;
            seriesView.LastPoint.Label.TextPattern = "{V:f2}";

            XYDiagram diagram = (XYDiagram)chartControl1.Diagram;
            diagram.AxisX.DateTimeScaleOptions.ScaleMode = ScaleMode.Continuous;
            diagram.AxisX.Label.ResolveOverlappingOptions.AllowRotate = false;
            diagram.AxisX.Label.ResolveOverlappingOptions.AllowStagger = false;
            diagram.AxisX.WholeRange.SideMarginsValue = 0;
            diagram.DependentAxesYRange = DefaultBoolean.True;
            diagram.AxisY.WholeRange.AlwaysShowZeroLevel = false;

            System.Windows.Forms.Timer timer = new System.Windows.Forms.Timer();
            timer.Interval = 100;
            timer.Start();
            timer.Tick += Timer_Tick;
        }
        int counter = 0;
        void Timer_Tick(object sender, EventArgs e) {
            dataPoints.Add(new DataPoint(DateTime.Now, GenerateValue(counter++)));
            if (dataPoints.Count > ViewportPointCount)
                dataPoints.RemoveAt(0);
        }
        double GenerateValue(double x) {
            return Math.Sin(x) * 3 + x / 2 + 5;
        }
    }
    public class DataPoint {
        public DateTime Argument { get; set; }
        public double Value { get; set; }
        public DataPoint(DateTime argument, double value) {
            Argument = argument;
            Value = value;
        }
    }
}
Collect Data in a Separate Thread
The following example uses a separate thread to accumulate data points. A new batch of data points is generated every 15 milliseconds. The chart fetches a new portion of points to visualize at a rate of ten times per second.
using DevExpress.Utils;
using DevExpress.XtraCharts;
using System;
using System.Collections.Generic;
using System.Collections.ObjectModel;
using System.ComponentModel;
using System.Threading;
using System.Windows.Forms;

namespace RealTimeChartUpdates {
    public partial class Form1 : Form {
        const int ViewportPointCount = 5000;
        int counter = 0;
        Thread dataAcquisitionThread;
        bool isEnabled = true;
        int lastRawDataIndex = 0;
        List<DataPoint> rawData = new List<DataPoint>();
        ObservableCollection<DataPoint> viewportData = new ObservableCollection<DataPoint>();
        public Form1() { InitializeComponent(); }
        void Form1_Load(object sender, EventArgs e) {
            dataAcquisitionThread = new Thread(new ThreadStart(AcquireData));
            dataAcquisitionThread.Start();

            chartControl1.Titles.Add(new ChartTitle { Text = "Real-Time Charting" });

            Series series = new Series();
            series.ChangeView(ViewType.Line);
            series.DataSource = viewportData;
            series.DataSourceSorted = true;
            series.ArgumentDataMember = "Argument";
            series.ValueDataMembers.AddRange("Value");
            chartControl1.Series.Add(series);

            LineSeriesView seriesView = (LineSeriesView)series.View;
            seriesView.LastPoint.LabelDisplayMode = SidePointDisplayMode.SeriesPoint;
            seriesView.LastPoint.Label.TextPattern = "{V:f2}";

            XYDiagram diagram = (XYDiagram)chartControl1.Diagram;
            diagram.AxisX.DateTimeScaleOptions.ScaleMode = ScaleMode.Continuous;
            diagram.AxisX.Label.ResolveOverlappingOptions.AllowRotate = false;
            diagram.AxisX.Label.ResolveOverlappingOptions.AllowStagger = false;
            diagram.AxisX.VisualRange.EndSideMargin = 200;
            diagram.DependentAxesYRange = DefaultBoolean.True;
            diagram.AxisY.WholeRange.AlwaysShowZeroLevel = false;

            System.Windows.Forms.Timer timer = new System.Windows.Forms.Timer();
            timer.Interval = 100;
            timer.Start();
            timer.Tick += Timer_Tick;
        }
        void AcquireData() {
            while (isEnabled) {
                Thread.Sleep(15);
                lock (rawData) {
                    for (int i = 0; i < 50; i++)
                        rawData.Add(new DataPoint(DateTime.Now, GenerateValue(counter++)));
                }
            }
        }
        double GenerateValue(double x) { return Math.Sin(x / 1000.0) * 3 * x + x / 2 + 5; }
        void Timer_Tick(object sender, EventArgs e) {
            lock (rawData) {
                for (int i = Math.Max(lastRawDataIndex, rawData.Count - ViewportPointCount); i < rawData.Count; i++)
                    viewportData.Add(rawData[i]);
                lastRawDataIndex = rawData.Count;
                while (viewportData.Count > ViewportPointCount)
                    viewportData.RemoveAt(0);
            }
        }
        protected override void OnClosing(CancelEventArgs e) {
            isEnabled = false;
            base.OnClosing(e);
        }
        public class DataPoint {
            public DataPoint(DateTime argument, double value) {
                Argument = argument;
                Value = value;
            }
            public DateTime Argument { get; set; }
            public double Value { get; set; }
        }
    }
}