TdxChartXYSeriesLineValueLabels Class
Stores value label appearance and behavior settings for an XY series with an active Line or Area View.
Declaration
TdxChartXYSeriesLineValueLabels = class(
    TdxChartXYSeriesValueLabels
)
Remarks
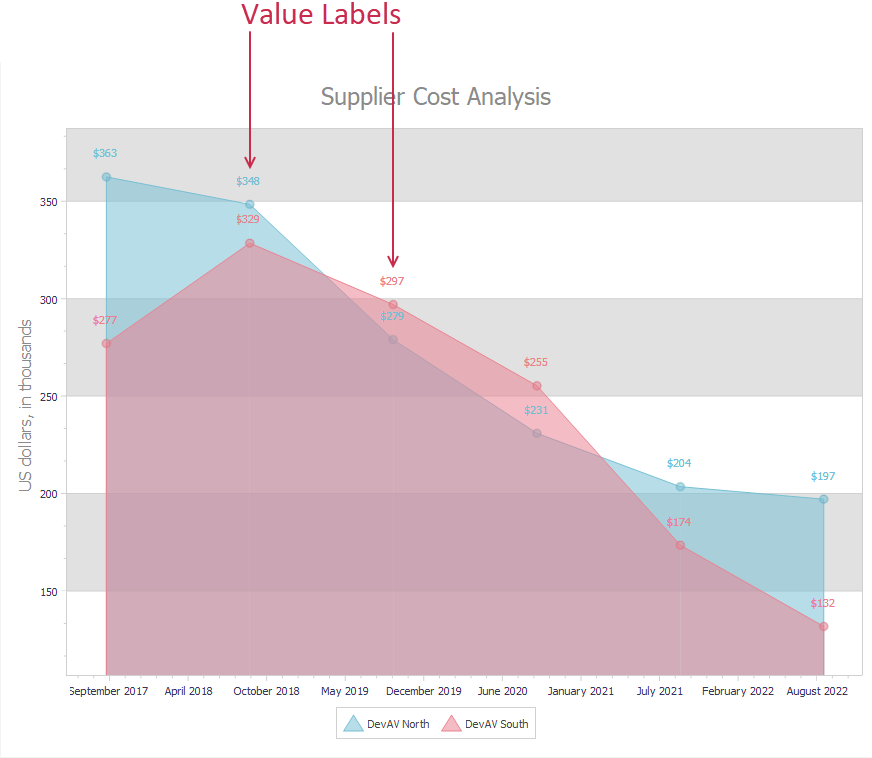
Value labels mark individual series values.
Main API Members
The list below outlines key members of the TdxChartXYSeriesLineValueLabels class that allow you to customize XY series value labels when any Line or Area View is active.
- Visible
- Hides or displays series value labels.
- Appearance
- Provides access to general appearance settings of series value labels.
- LineLength
- Specifies the length (in pixels) of lines that connect value points and the corresponding labels.
- LineVisible
- Specifies if lines between value labels and corresponding series points are visible.
- TextFormat
- Specifies a formatting pattern for value labels.
- MaxWidth | MaxLineCount
- Limit the width of value labels and the maximum number of text lines in them.
- ResolveOverlappingMode
- Specifies the active label overlap resolution mode.
- ResolveOverlappingIndent
- Specifies the base minimum distance (in pixels) between value labels when value label resolution is enabled.
- Assign
- Copies compatible value label settings between XY series.
Tip
If you need to customize individual series value labels, handle an XY diagram‘s OnGetValueLabelDrawParameters event.
Direct TdxChartXYSeriesLineValueLabels Class Reference
The ValueLabels property of a Line or Area XY series View references the TdxChartXYSeriesLineValueLabels class as a TdxChartXYSeriesValueLabels object.
Inheritance
See Also