Chart Appearance Customization Events
- 3 minutes to read
In addition to general appearance settings and palettes, the Chart control has dedicated customization events that allow you to change the appearance of individual visual elements based on certain conditions or events in your application.
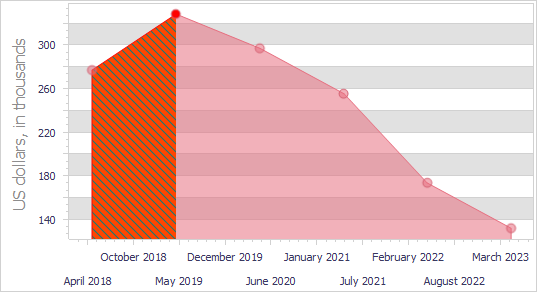
Chart appearance customization events occur every time the Chart control is about to determine how to draw the corresponding visual element. Any changes made in handlers of these events have higher priority than all other appearance customization options.
Series Point Customization Event
The OnGetSeriesPointDrawParameters event available at the diagram level allows you to change the appearance of individual series points.
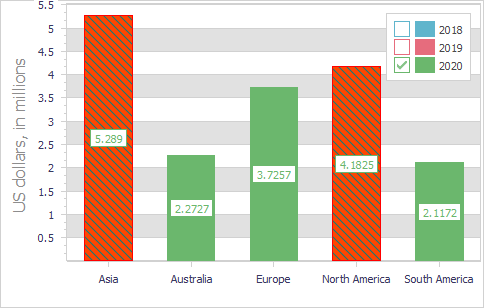
Code Example: Change Peak Point Appearance
The following code example demonstrates a diagram’s OnGetSeriesPointDrawParameters event handler that changes the appearance settings of all bars that display peak values in a Simple Bar series.
procedure TMyForm.cdBarGetSeriesPointDrawParameters(Sender: TdxChartCustomDiagram;
  AArgs: TdxChartGetSeriesPointDrawParametersEventArgs);
var
  ABarDrawParameters: TdxChartBarSeriesPointDrawParameters;
  ASeries: TdxChartCustomSeries;
  AIndex: Integer;
begin
  if AArgs.SeriesPoint.Series.Caption = '2020' then
  begin
    if AArgs.DrawParameters.ClassType <> TdxChartBarSeriesPointDrawParameters then Exit;
    ABarDrawParameters := AArgs.DrawParameters as TdxChartBarSeriesPointDrawParameters;
    AIndex := AArgs.SeriesPoint.Index;
    ASeries := AArgs.SeriesPoint.Series;
    if ((AIndex = 0) and (ASeries.Points.Values[AIndex] > ASeries.Points.Values[AIndex + 1])) or
       ((AIndex > 0) and (AIndex < ASeries.Points.Count - 1) and
       (ASeries.Points.Values[AIndex] > ASeries.Points.Values[AIndex + 1]) and
        (ASeries.Points.Values[AIndex] > ASeries.Points.Values[AIndex - 1])) then
    begin
      ABarDrawParameters.Appearance.BeginUpdate;
      ABarDrawParameters.Appearance.FillOptions.Color := TdxAlphaColors.OrangeRed;
      ABarDrawParameters.Appearance.FillOptions.Mode := TdxFillOptionsMode.Hatch;
      ABarDrawParameters.Appearance.FillOptions.HatchStyle := TdxFillOptionsHatchStyle.ForwardDiagonal;
      ABarDrawParameters.Appearance.FillOptions.Color2 := TdxAlphaColors.Teal;
      ABarDrawParameters.Appearance.StrokeOptions.Color := TdxAlphaColors.Red;
      ABarDrawParameters.Appearance.StrokeOptions.Style := TdxStrokeStyle.Solid;
      ABarDrawParameters.Appearance.EndUpdate;
    end;
  end;
end;
Refer to the following topic descriptions for more code examples and detailed information on all available options:
- TdxChartCustomDiagram.OnGetSeriesPointDrawParameters
- Allows you to customize the appearance of individual series points.
- TdxChartPalette.GetColorsForIndex
- Returns a stored or interpolated palette item for the target index.
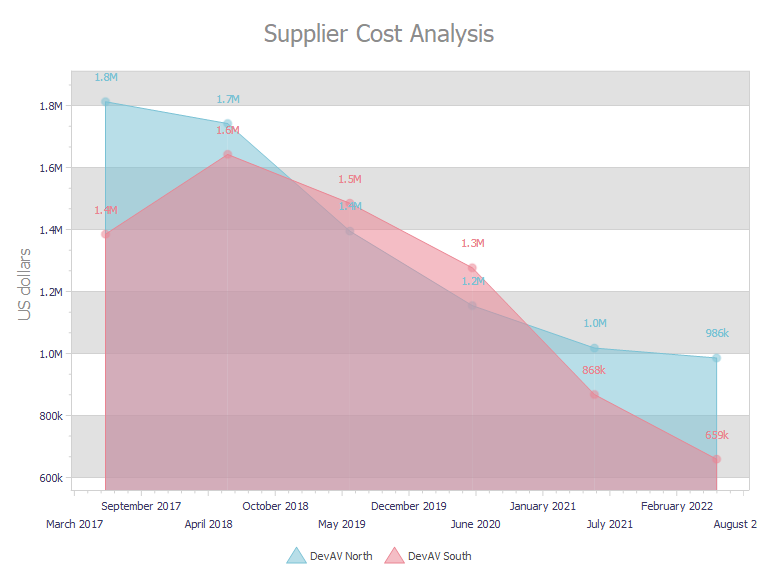
Label Customization Events
OnGetValueLabelDrawParameters and OnGetTotalLabelDrawParameters[1] events available at the diagram level allow you to customize individual series labels.
Code Example: Change Measurement Units Based on Value
The code example below displays different measurement units in value labels. If a series value exceeds one million, the corresponding value label displays the million digits followed by the M character. If a series value exceeds one thousand but is less than one million, the corresponding value label displays the thousands digits followed by the k character.
procedure TMyForm.cdAreaGetValueLabelDrawParameters(Sender: TdxChartCustomDiagram;
  AArgs: TdxChartGetValueLabelDrawParametersEventArgs);
begin
  if AArgs.SeriesPoint.Value >= 1000 * 1000 then // Millions
    AArgs.Text := Format('%.1fM', [AArgs.SeriesPoint.Value / (1000 * 1000)])
  else if AArgs.SeriesPoint.Value >= 1000 then // Thousands
    AArgs.Text := Format('%.0fk', [AArgs.SeriesPoint.Value / 1000])
  else
    AArgs.Text := Format('%0f', [AArgs.SeriesPoint.Value]);
end;
Refer to OnGetValueLabelDrawParameters and OnGetTotalLabelDrawParameters event descriptions for detailed information on all parameters accessible in event handlers.
-
This event is available only for simple diagrams because only a simple series can have a total label that displays a sum of all series values.