VCL Chart Simple Tooltips
- 3 minutes to read
Simple tooltips display a series caption, argument, and/or value when a user hovers the mouse pointer over a series or series point.
Enable Simple Tooltips
Simple tooltips are available for all diagram types. To enable simple tooltips at the Chart control level, set the ToolTips.DefaultMode property to TdxChartToolTipMode.Simple.
Alternatively, you can set an individual diagram‘s ToolTips.Mode property to TdxChartToolTipMode.Simple to enable simple tooltips for the diagram regardless of the parent Chart control’s ToolTips.DefaultMode property value. Available diagram types have different tooltip mode settings because only XY diagrams support Crosshair Cursor:
- TdxChartSimpleDiagramToolTipOptions.Mode
- Specifies the active tooltip display mode for a simple diagram.
- TdxChartXYDiagramToolTipOptions.Mode
- Specifies the active tooltip display mode for an XY diagram.
Series and Series Point Tooltips
Users can hover the mouse pointer over a series area or point to display a series or series point tooltip, respectively.
The Chart control’s ToolTips.SimpleToolTipOptions.ShowForSeries and ToolTips.SimpleToolTipOptions.ShowForPoints properties allow you to independently disable or enable simple series for series areas and series points.
Tip
You can use the ToolTips.Enabled property of an individual series to disable or enable tooltip functionality for the series.
Customize Simple Tooltips
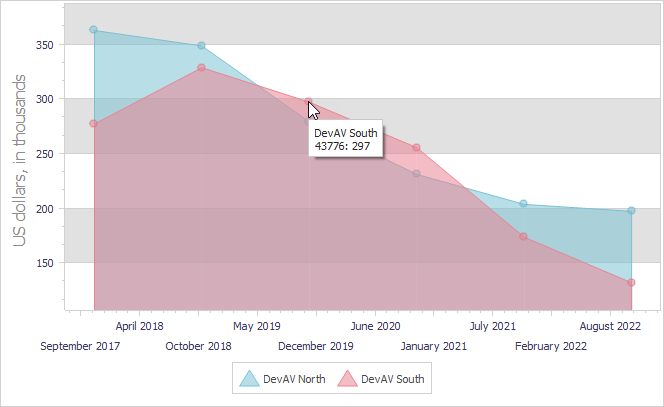
Simple tooltips for series and series points support the same formatting patterns as series value labels. A custom formatting pattern is particularly useful when you need to display a date or time value in a tooltip, add measurement units, or display additional information. The image below demonstrates a tooltip that displays both argument and value without formatting.
You can define custom formatting patterns at the diagram or series level:
Diagram Tooltip Format
ToolTips.SeriesToolTipFormat and ToolTips.PointToolTipFormat properties of a diagram specify formatting patterns for all series and their tooltips in the diagram.
Series Tooltip Format
ToolTips.SeriesToolTipFormat and ToolTips.PointToolTipFormat properties of a series define area and point tooltip formatting patterns for the series. These properties override the corresponding tooltip formatting settings defined at the parent diagram level.
Code Example
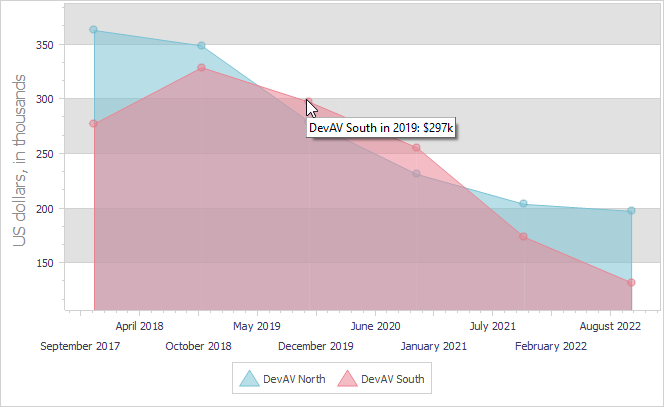
The following code example defines a custom formatting pattern for series point tooltips at the diagram level in a Chart control with one XY diagram and two simple Area series:
var
  AXYDiagram: TdxChartXYDiagram;
begin
  AXYDiagram := dxChartControl1.Diagrams[0] as TdxChartXYDiagram;
  AXYDiagram.ToolTips.Mode := TdxChartToolTipMode.Simple;  // Enables simple tooltips
  AXYDiagram.ToolTips.PointToolTipFormat := '{S} in {A:yyyy}: ${V}k';
end;
Limitations
A simple series can display a series tooltip only when series point tooltips are disabled (the parent Chart control’s ToolTips.SimpleToolTipOptions.ShowForPoints property is set to False). Otherwise, the currently displayed series point tooltip overrides a series tooltip.
If you need to include a series caption into a point tooltip of a simple series, include the {S} placeholder field into a tooltip formatting pattern at the series or diagram level.
Tooltip Scaling in RAD Studio 10.3 and Earlier IDEs
Tooltips do not scale properly according to the current monitor DPI in projects built with Embarcadero RAD Studio® 10.3 and earlier IDEs due to a tooltip implementation bug in the VCL library.
To work around this bug, you need to place the TcxHintStyleController component on a form.