ChoroplethMapItem Class
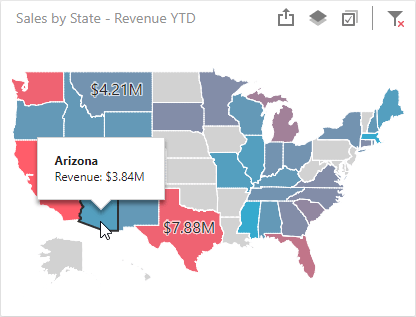
A Choropleth Map dashboard item that colors areas depending on the provided values.
Declaration
export class ChoroplethMapItem extends MapItemRemarks
The Choropleth Map dashboard item allows you to colorize required areas in proportion to the provided values. For instance, you can visualize a sales amount or population density.

See Web Dashboard - Creating a Choropleth Map to learn more about the Choropleth Map.
Inherited Members
Inheritance
constructor
Initializes a new instance of the ChoroplethMapItem class.
Declaration
constructor(
    modelJson?: any,
    serializer?: DevExpress.Analytics.Utils.ModelSerializer
)
Parameters
| Name | Type | Description |
|---|---|---|
| modelJson | any | A JSON object used for dashboard deserialization. Do not pass this parameter directly. |
| serializer | ModelSerializer | An object used for dashboard deserialization. Do not pass this parameter directly. |
Properties
attributeDimension Property
Declaration
attributeDimension: ko.Observable<DevExpress.Dashboard.Model.Dimension>Property Value
| Type |
|---|
| Observable<Dimension> |
attributeName Property
Declaration
attributeName: ko.Observable<string>Property Value
| Type |
|---|
| Observable<string> |
choroplethMapTypesMap Property
Declaration
static choroplethMapTypesMap: {
    ValueMap: {
        constructor: typeof DevExpress.Dashboard.Model.ValueMap;
        displayName: string;
        icon: string;
    };
    DeltaMap: {
        constructor: typeof DevExpress.Dashboard.Model.DeltaMap;
        displayName: string;
        icon: string;
    };
}
Property Value
| Name | Type |
|---|---|
| DeltaMap | {constructor: typeof DeltaMap, displayName: string, icon: string} |
| ValueMap | {constructor: typeof ValueMap, displayName: string, icon: string} |
includeSummaryValueToShapeTitle Property
Declaration
includeSummaryValueToShapeTitle: ko.Observable<boolean>Property Value
| Type |
|---|
| Observable<boolean> |
maps Property
Declaration
maps: ko.ObservableArray<DevExpress.Dashboard.Model.ChoroplethMap>Property Value
| Type |
|---|
| ObservableArray<ChoroplethMap> |
tooltipAttributeName Property
Declaration
tooltipAttributeName: ko.Observable<string>Property Value
| Type |
|---|
| Observable<string> |