ScatterChartItem Class
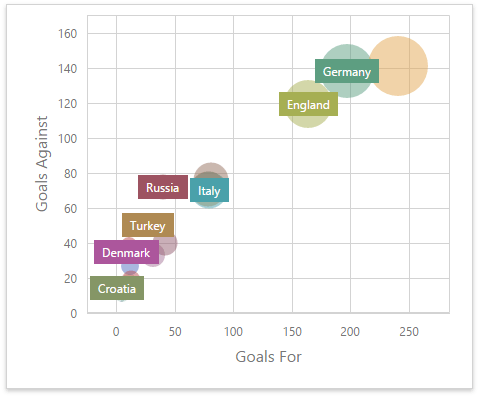
A Scatter Chart dashboard item that visualizes relationships between numerical variables.
Declaration
export class ScatterChartItem extends DataDashboardItem
The Scatter Chart dashboard item provides the capability to visualize relationships between numerical variables.
The following documentation is available: Web Dashboard - Creating a Scatter Chart.
Example
The following example shows how to create the Scatter Chart dashboard item, bind it to data and add to the existing dashboard.
Create data items (measures and dimensions) and use the DataItem.dataMember property to bind them to the existing data source’s columns. Then use the created measures and dimensions in the dashboard item to bind it to data.
After you add the created dashboard item to the Dashboard.items collection, call the Dashboard.rebuildLayout method to rebuild the dashboard layout and display changes.
// Use the line below for a modular approach:
// import * as Model from 'devexpress-dashboard/model'
// Use the line below for an approach with global namespaces:
// var Model = DevExpress.Dashboard.Model;

// ...
public createScatterChartItem() {
    // Create data items for the Scatter Chart dashboard item.
    var scatterChartCategoryName = new Model.Dimension();
    scatterChartCategoryName.dataMember("CategoryName");
    var scatterChartProductName = new Model.Dimension();
    scatterChartProductName.dataMember("ProductName");
    var scatterChartUnitPrice = new Model.Measure();
    scatterChartUnitPrice.dataMember("UnitPrice");
    var scatterChartExtendedPrice = new Model.Measure();
    scatterChartExtendedPrice.dataMember("ExtendedPrice");
    var scatterChartQuantity = new Model.Measure();
    scatterChartQuantity.dataMember("Quantity");

    // Create the Scatter Chart dashboard item and bind it to data.
    var scatterChartItem = new Model.ScatterChartItem();
    scatterChartItem.name('scatterChart');
    scatterChartItem.dataSource(sqlDataSource.componentName());
    scatterChartItem.dataMember(sqlDataSource.queries()[0].name());

    scatterChartItem.arguments.push(scatterChartCategoryName, scatterChartProductName);
    scatterChartItem.weight(scatterChartUnitPrice);
    scatterChartItem.axisXMeasure(scatterChartQuantity);
    scatterChartItem.axisYMeasure(scatterChartExtendedPrice);

    scatterChartItem.interactivityOptions.isDrillDownEnabled(true);

    control.dashboard().items.push(scatterChartItem);
    // ...
    control.dashboard().rebuildLayout();
}
constructor
Initializes a new instance of the ScatterChartItem class.
Declaration
constructor(
    modelJson?: any,
    serializer?: DevExpress.Analytics.Utils.ModelSerializer
)
Parameters
| Name |
Type |
Description |
| modelJson |
any |
A JSON object used for dashboard deserialization. Do not pass this parameter directly.
|
| serializer |
ModelSerializer |
An object used for dashboard deserialization. Do not pass this parameter directly.
|
Properties
arguments Property
Declaration
arguments: ko.ObservableArray<DevExpress.Dashboard.Model.Dimension>
Property Value
axisX Property
Declaration
axisX: DevExpress.Dashboard.Model.ChartAxisY
Property Value
axisXMeasure Property
Declaration
axisXMeasure: ko.Observable<DevExpress.Dashboard.Model.Measure>
Property Value
axisY Property
Declaration
axisY: DevExpress.Dashboard.Model.ChartAxisY
Property Value
axisYMeasure Property
Declaration
axisYMeasure: ko.Observable<DevExpress.Dashboard.Model.Measure>
Property Value
interactivityOptions Property
Declaration
interactivityOptions: DevExpress.Dashboard.Model.DashboardItemInteractivityOptions
Property Value
legend Property
Declaration
legend: DevExpress.Dashboard.Model.ChartLegend
Property Value
pointLabelOptions Property
Declaration
pointLabelOptions: DevExpress.Dashboard.Model.ScatterPointLabelOptions
Property Value
rotated Property
Declaration
rotated: ko.Observable<boolean>
Property Value
weight Property
Declaration
weight: ko.Observable<DevExpress.Dashboard.Model.Measure>
Property Value