Descriptive Elements in Blazor Charts
- 13 minutes to read
Blazor Charts support multiple descriptive elements: a legend, title, subtitle, and tooltip. To display these elements on the chart plane, add the corresponding nested components to the Chart markup.
Legend
The chart legend (DxChartLegend) lists chart series or pie sectors. The unique identifier (Name) of the series serves as the legend item text in DxChart and DxPolarChart. Since DxPieChart treats each sector as an individual point and generates legend items based on arguments, the DxPieChartSeries.Name property does not affect the Pie Chart’s legend.

<DxChart Data="@DataSource">
    <DxChartBarSeries ArgumentField="@((StatisticPoint v) => v.Country)"
                      ValueField="@((StatisticPoint v) => v.Population24)"
                      Name="2024" />
    <DxChartLineSeries ArgumentField="@((StatisticPoint v) => v.Country)"
                       ValueField="@((StatisticPoint v) => v.Population23)"
                       Name="2023" />
</DxChart>

@code {
    IEnumerable<StatisticPoint> DataSource = Enumerable.Empty<StatisticPoint>();
    protected override void OnInitialized() {
        DataSource = GenerateData();
    }
}
You can customize common legend settings at the DxChartLegend component level and configure individual legend items at the DxChartSeriesLegendItem component level.
Common Legend Settings
Add a DxChartLegend object to the Chart markup to access and configure the following legend settings:
- AllowToggleSeries
- Specifies whether users can toggle series visibility.
- HorizontalAlignment | VerticalAlignment | Position
- Specify legend location.
- Orientation
- Specifies how legend items are arranged, vertically (in a column) or horizontally (in a row).
- HoverMode
- Specifies what series elements to highlight when the mouse pointer hovers over a legend item.
- Visible
- Specifies the legend’s visibility. Set this property to
falseto hide the legend.
Note
We do not recommend that you set the Position property to Inside for legends in DxPolarChart and DxPieChart components.
The following code snippet changes the legend location, arranges legend items vertically, and displays checkboxes:

<DxChart Data="@DataSource">
    <DxChartBarSeries ArgumentField="@((StatisticPoint v) => v.Country)"
                      ValueField="@((StatisticPoint v) => v.Population24)"
                      Name="2024" />
    <DxChartLineSeries ArgumentField="@((StatisticPoint v) => v.Country)"
                       ValueField="@((StatisticPoint v) => v.Population23)"
                       Name="2023" />
    <DxChartLegend Orientation="Orientation.Vertical"
                   HorizontalAlignment="HorizontalAlignment.Right"
                   Position="RelativePosition.Outside"
                   AllowToggleSeries="true" />
</DxChart>
The chart legend can display a title (DxChartTitle ) and subtitle (DxChartSubTitle ). Add these components as nested objects to the legend markup and specify their Text properties.

<DxChart Data="@DataSource">
    <DxChartBarSeries ArgumentField="@((StatisticPoint v) => v.Country)"
                      ValueField="@((StatisticPoint v) => v.Population24)"
                      Name="2024" />
    <DxChartLineSeries ArgumentField="@((StatisticPoint v) => v.Country)"
                       ValueField="@((StatisticPoint v) => v.Population23)"
                       Name="2023" />
    <DxChartLegend Orientation="Orientation.Vertical"
                   HorizontalAlignment="HorizontalAlignment.Right"
                   Position="RelativePosition.Outside">
        <DxChartTitle Text="Years">
            <DxChartSubTitle Text="(2023-2024)" />
        </DxChartTitle>
    </DxChartLegend>
</DxChart>
See the Titles and Subtitles section below for more information.
Individual Legend Item Configuration
Chart components allow you to configure individual legend items (for example, customize icons or override item text).
Add a DxChartSeriesLegendItem object to a series markup to access the legend item’s settings. You can specify the following properties:
- IconCssClass
- Specifies the cascading style sheet (CSS) class name for the series legend item.
- Text | TextTemplate
- Customize legend item text
- VisibleIndex
- Specifies the legend item’s visible index.
- Visible
- Specifies whether the legend item is visible. Set this property to
falseto hide the legend item.
Note
DxPieChart<T> generates legend items based on arguments. That is why DxChartSeriesLegendItem properties affect all legend items that correspond to the arguments of the same pie series.
The following code snippet customizes legend items:

<DxChart Data="@DataSource">
    <DxChartBarSeries ArgumentField="@((StatisticPoint v) => v.Country)"
                       ValueField="@((StatisticPoint v) => v.Population24)"
                       Name="2024">
        <DxChartSeriesLegendItem VisibleIndex="1"
                                 IconCssClass="icon-calendar" />
    </DxChartBarSeries>
    <DxChartLineSeries ArgumentField="@((StatisticPoint v) => v.Country)"
                       ValueField="@((StatisticPoint v) => v.Population23)"
                       Name="2023">
        <DxChartSeriesLegendItem VisibleIndex="0" />
    </DxChartLineSeries>
     <DxChartLegend Orientation="Orientation.Vertical"
                    HorizontalAlignment="HorizontalAlignment.Right"
                    Position="RelativePosition.Outside">
        <DxChartTitle Text="Years">
            <DxChartSubTitle Text="(2023-2024)" />
        </DxChartTitle>
     </DxChartLegend>
</DxChart>
Respond to Legend Item Clicks
When users click legend items, Chart components raise their LegendClick events (DxChart.LegendClick, DxPolarChart.LegendClick, or DxPieChart.LegendClick). In a handler, you can use the event’s argument properties to obtain information about the series (for all chart types) and the point (for DxPieChart only) associated with the clicked legend item.
<DxChart Data="@DataSource"
         @ref="chart"
         Width="1200px"
         Height="300px"
         SeriesSelectionMode="ChartSelectionMode.Single"
         LegendClick="@OnChartLegendClick">
    <DxChartBarSeries ArgumentField="@((StatisticPoint v) => v.Country)"
                      ValueField="@((StatisticPoint v) => v.Population24)"
                      Name="2024"
                      HoverMode="ChartSeriesPointHoverMode.None" />
    <DxChartLineSeries ArgumentField="@((StatisticPoint v) => v.Country)"
                       ValueField="@((StatisticPoint v) => v.Population23)"
                       Name="2023"
                       HoverMode="ChartContinuousSeriesHoverMode.None" />
    <DxChartLegend HoverMode="ChartLegendHoverMode.None" />
</DxChart>

@code {
    DxChart<StatisticPoint> chart;

    public void OnChartLegendClick(ChartLegendClickEventArgs args) {
        if (args.Series != null) {
            var SeriesName = args.Series.Name;
            var TotalPopulation = SeriesName == "2023" ? DataSource.Select(x => x.Population23).Sum() : DataSource.Select(x => x.Population24).Sum();
            ShowDetailDialog(SeriesName, TotalPopulation);
        }
    }
    // ...
}
Titles and Subtitles
Blazor Charts can display titles (DxChartTitle ) and subtitles (DxChartSubTitle ) for the chart area and legend.

To display a title for the chart or its legend, add a DxChartTitle object to the chart or legend markup and specify the DxChartTitle.Text property. You can also specify the following properties:
- CssClass
- Specifies the title’s CSS class.
- HorizontalAlignment | VerticalAlignment
- Align the title and subtitle horizontally and vertically.
To display a subtitle, add a DxChartSubTitle object to the title markup and specify the DxChartSubTitle.Text property. Use the subtitle’s CssClass property to apply customizations.
The following code snippet positions chart titles at the bottom of chart panes, aligns legend titles to the left, and customizes the appearance of chart and legend subtitles:

<DxChart Data="@DataSource">
    <DxChartBarSeries ArgumentField="@((StatisticPoint v) => v.Country)"
                      ValueField="@((StatisticPoint v) => v.Population24)"
                      Name="2024">
        <DxChartSeriesLegendItem VisibleIndex="1"
                                 IconCssClass="icon-calendar" />
    </DxChartBarSeries>
    <DxChartLineSeries ArgumentField="@((StatisticPoint v) => v.Country)"
                       ValueField="@((StatisticPoint v) => v.Population23)"
                       Name="2023">
        <DxChartSeriesLegendItem VisibleIndex="0" />
    </DxChartLineSeries>
    <DxChartTitle Text="Population" VerticalAlignment="VerticalEdge.Bottom">
        <DxChartSubTitle Text="by European Country" CssClass="subtitle-css-class" />
    </DxChartTitle>
    <DxChartLegend>
        <DxChartTitle Text="Years" HorizontalAlignment="HorizontalAlignment.Left">
            <DxChartSubTitle Text="(2023-2024)" CssClass="subtitle-css-class" />
        </DxChartTitle>
    </DxChartLegend>
</DxChart>
Tooltips
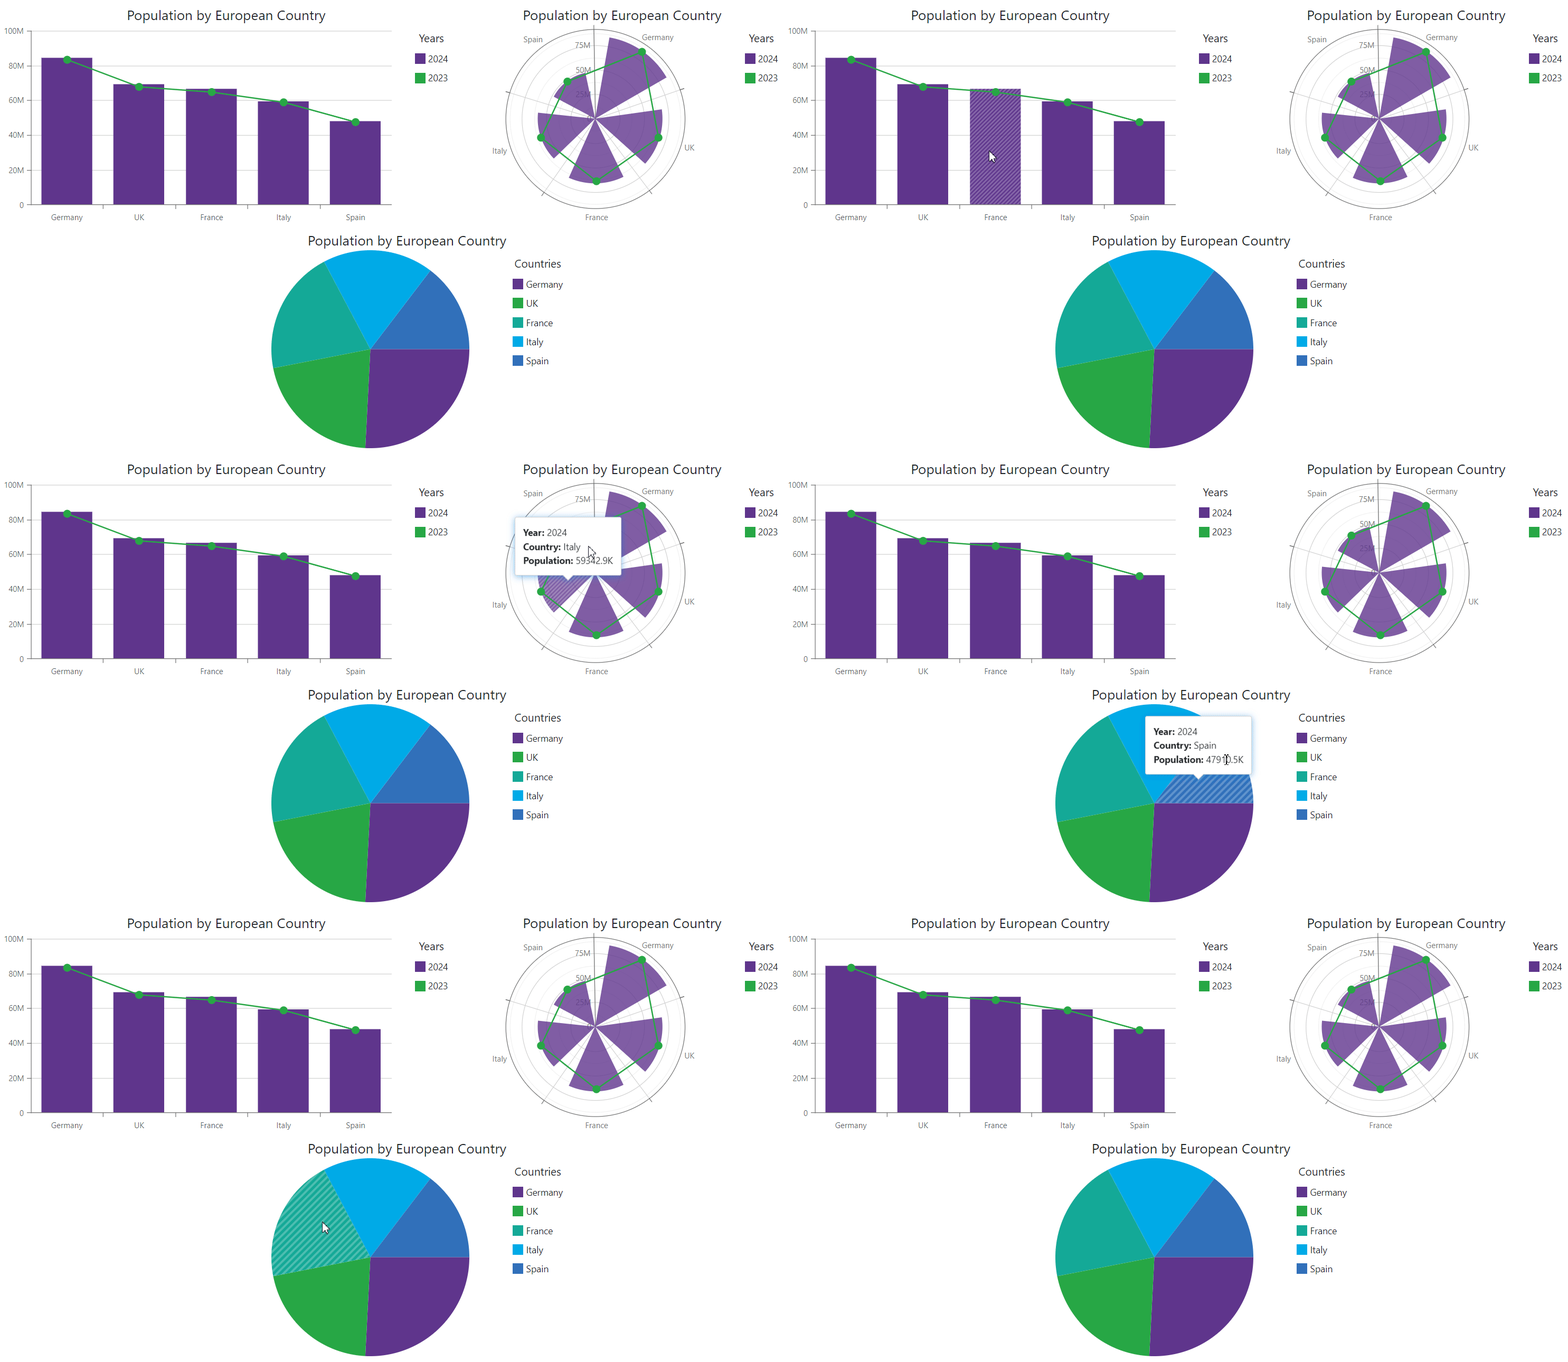
Blazor Charts can display tooltips when the mouse pointer is above a chart series, series point, or pie sector. Add a DxChartTooltip object to the Chart markup and set the DxChartTooltip.Enabled property to true to activate the tooltip functionality.

<DxChart Data="@DataSource">
    <DxChartBarSeries ArgumentField="@((StatisticPoint v) => v.Country)"
                      ValueField="@((StatisticPoint v) => v.Population24)"
                      Name="2024" />
    <DxChartLineSeries ArgumentField="@((StatisticPoint v) => v.Country)"
                       ValueField="@((StatisticPoint v) => v.Population23)"
                       Name="2023" />
    <DxChartTitle Text="Population by European Country" />
    <DxChartLegend Position="RelativePosition.Outside"
                   Orientation="Orientation.Vertical"
                   HorizontalAlignment="HorizontalAlignment.Right">
        <DxChartTitle Text="Years" />
    </DxChartLegend>
    <DxChartTooltip Enabled="true" />
</DxChart>
Chart components display tooltips inside series points. Set the DxChartTooltip.Position property to Outside to display tooltips outside series points. Note that this property applies to a limited number of series types in the <DxChart> component.

<DxChart Data="@DataSource">
    <DxChartBarSeries ArgumentField="@((StatisticPoint v) => v.Country)"
                      ValueField="@((StatisticPoint v) => v.Population24)"
                      Name="2024" />
    <DxChartLineSeries ArgumentField="@((StatisticPoint v) => v.Country)"
                       ValueField="@((StatisticPoint v) => v.Population23)"
                       Name="2023" />
    @* ... *@
    <DxChartTooltip Enabled="true" Position="RelativePosition.Outside"/>
</DxChart>
Tooltip Templates
Blazor Charts allow you to create templates for tooltips. You can use the DxChartTooltip.ChildContent property to store custom tooltip content or omit the <ChildContent> tag and add tooltip content directly to the DxChartTooltip component markup. The ChartTooltipData object stores information about the hovered series or series point. Use the @context parameter to access this information.

<DxChart Data="@DataSource">
    <DxChartBarSeries ArgumentField="@((StatisticPoint v) => v.Country)"
                      ValueField="@((StatisticPoint v) => v.Population24)"
                      Name="2024" />
    <DxChartLineSeries ArgumentField="@((StatisticPoint v) => v.Country)"
                       ValueField="@((StatisticPoint v) => v.Population23)"
                       Name="2023" />
    @* ... *@
    <DxChartTooltip Enabled="true">
        @context.Point.Render((seriesPoint) =>
            @<div style="margin: 0.75rem">
                <div><b>Year:</b> @seriesPoint.SeriesName</div>
                <div><b>Country:</b> @seriesPoint.Argument</div>
                <div><b>Population:</b> @($"{seriesPoint.Value: 0,.0}K")</div>
            </div>
        )
    </DxChartTooltip>
</DxChart>
Show and Hide Tooltips in Code
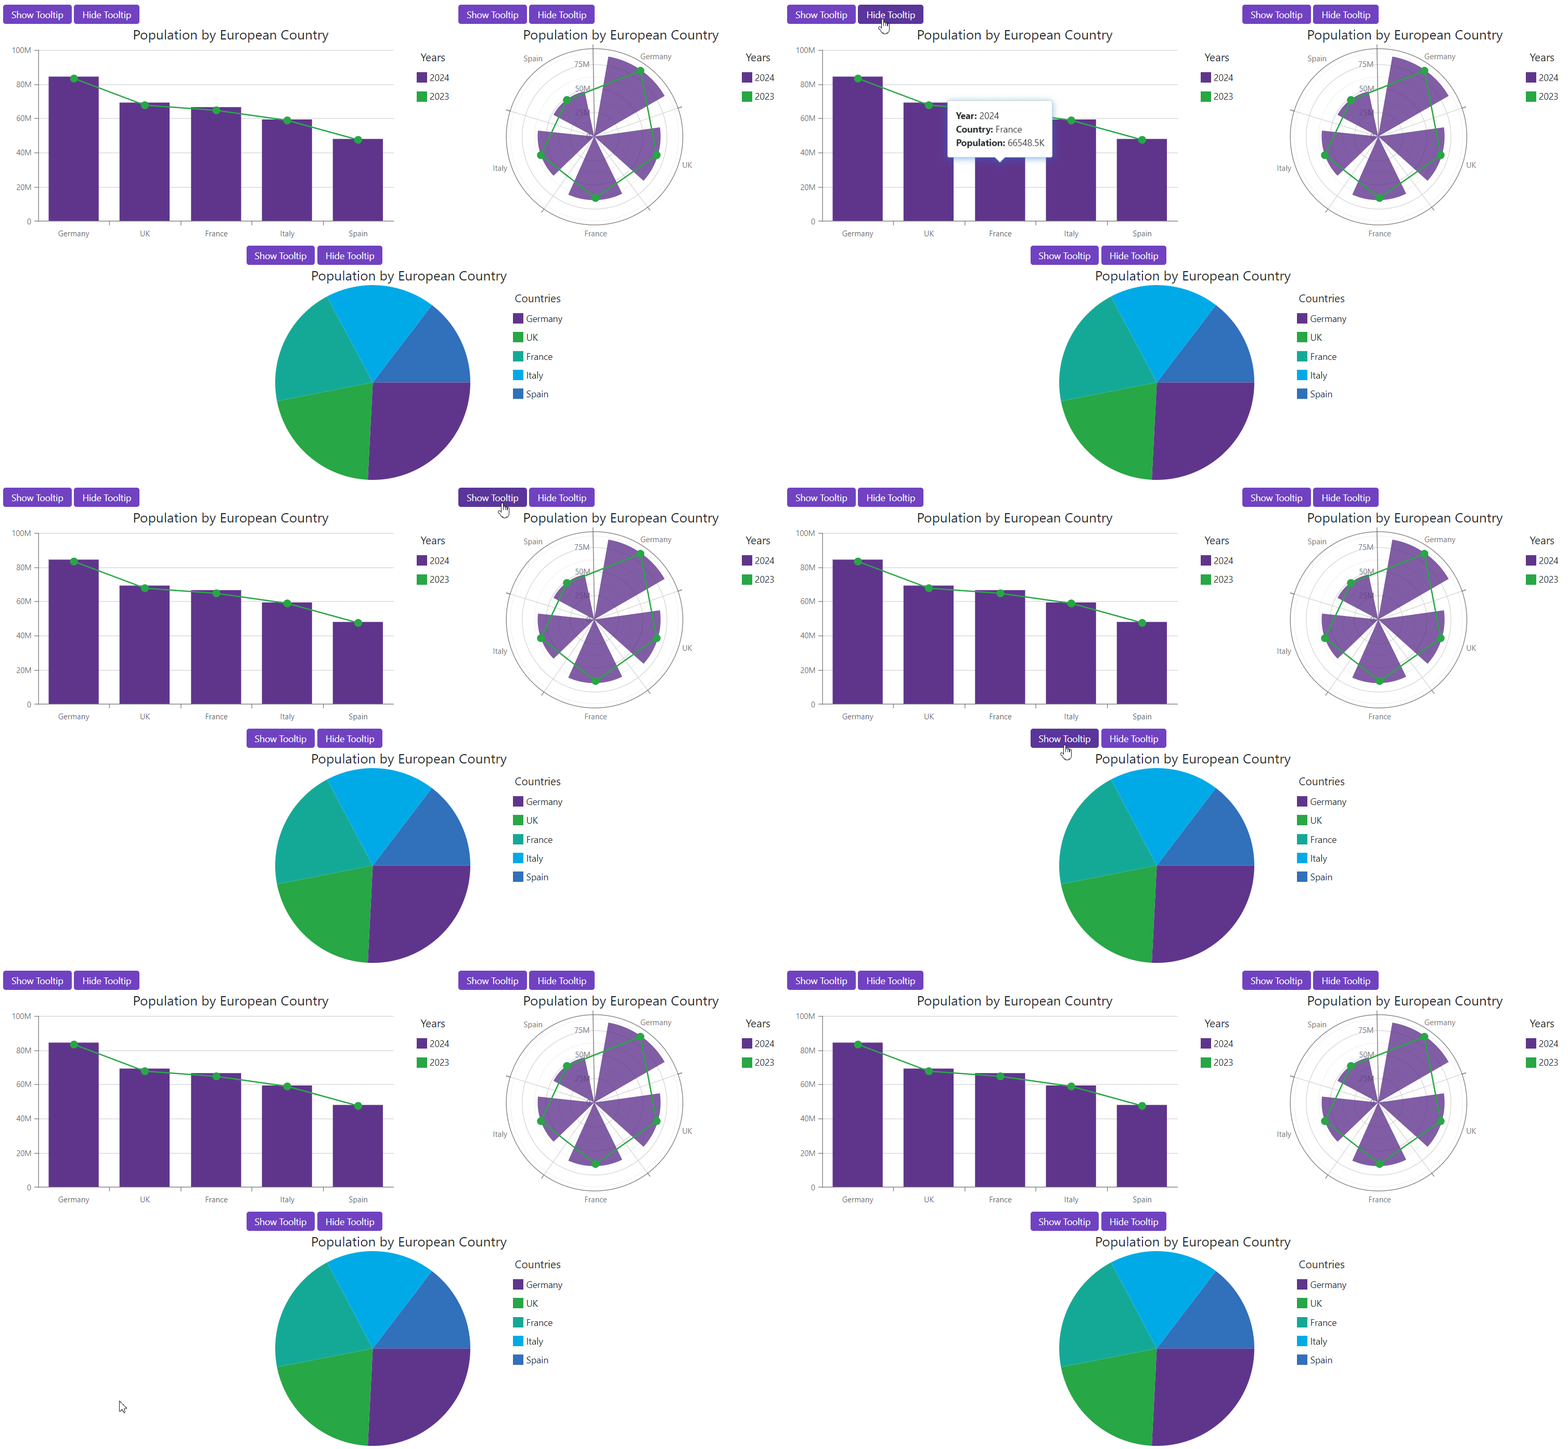
Blazor Charts allow you to change tooltip visibility in code. Call DxChart.ShowTooltip, DxPolarChart.ShowTooltip, or DxPieChart.ShowTooltip method overloads to show the tooltip for the specified series or series point. To hide the tooltip, call the HideTooltip() method.
The following code snippet displays custom Show Tooltip and Hide Tooltip buttons that show and hide the tooltip for the specified series point:

<DxButton Text="Show Tooltip" Click="@ShowChartTooltip" />
<DxButton Text="Hide Tooltip" Click="@HideChartTooltip" />

<DxChart Data="@DataSource" @ref="@Chart">
    <DxChartBarSeries ArgumentField="@((StatisticPoint v) => v.Country)"
                      ValueField="@((StatisticPoint v) => v.Population24)"
                      Name="2024" />
    <DxChartLineSeries ArgumentField="@((StatisticPoint v) => v.Country)"
                       ValueField="@((StatisticPoint v) => v.Population23)"
                       Name="2023" />
    @* ... *@
    <DxChartTooltip Enabled="true">
        @context.Point.Render((seriesPoint) =>
            @<div style="margin: 0.75rem">
                <div><b>Year:</b> @seriesPoint.SeriesName</div>
                <div><b>Country:</b> @seriesPoint.Argument</div>
                <div><b>Population:</b> @($"{seriesPoint.Value: 0,.0}K")</div>
            </div>
        )
    </DxChartTooltip>
</DxChart>

@code {
    DxChart<StatisticPoint> Chart;
    void ShowChartTooltip() {
        var point = DataSource.Where(x => x.Country == "France").FirstOrDefault();
        if (point != null)
            Chart.ShowTooltip(point, "2024");
    }
    void HideChartTooltip() {
        Chart.HideTooltip();
    }
}
React to Tooltip Visibility Changes
Chart components raise the TooltipShowing event in the following cases:
- You call
ShowTooltipmethod overloads. - A user hovers the mouse pointer over a series, series point, or pie sector.
In the event handler, use the event’s TooltipInfo argument property to get information about the tooltip that is about to appear.
You can also set the event’s Cancel argument property to true to disable tooltip functionality for individual series or series points.
The following code snippet disables tooltips for the specified series points:

<DxChart Data="@DataSource"
         TooltipShowing="@OnTooltipShowing">
    <DxChartBarSeries ArgumentField="@((StatisticPoint v) => v.Country)"
                      ValueField="@((StatisticPoint v) => v.Population24)"
                      Name="2024" />
    <DxChartLineSeries ArgumentField="@((StatisticPoint v) => v.Country)"
                       ValueField="@((StatisticPoint v) => v.Population23)"
                       Name="2023" />
    @* ... *@
    <DxChartTooltip Enabled="true">
        @context.Point.Render((seriesPoint) =>
            @<div style="margin: 0.75rem">
                <div><b>Year:</b> @seriesPoint.SeriesName</div>
                <div><b>Country:</b> @seriesPoint.Argument</div>
                <div><b>Population:</b> @($"{seriesPoint.Value: 0,.0}K")</div>
            </div>
        )
    </DxChartTooltip>
</DxChart>