Range Area Chart
Short Description
The Range Area chart is represented by the RangeArea3DSeriesView object, which belongs to Area Series Views. This view displays series as filled areas on a diagram, with two data points that define minimum and maximum limits. This view is useful when you need to illustrate the difference between start and end values.
A Range Area chart is shown in the image below.
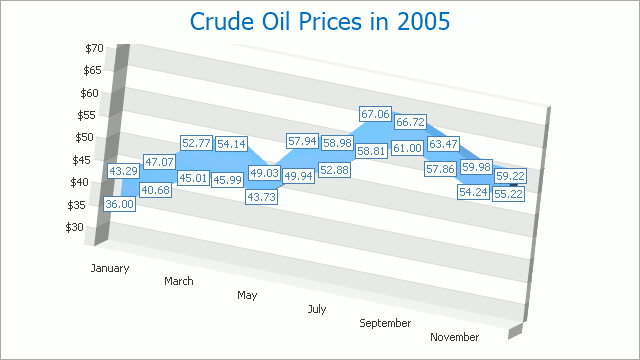
Chart Type Characteristics
The table below lists the main characteristics of this chart type.
| Feature | Value |
|---|---|
| Series View type | RangeArea3DSeriesView |
| Diagram type | XYDiagram3D |
| Number of arguments per series point | 1 |
| Number of values per series point | 2 |
Note
For information on which chart types can be combined with the Range Area Chart, refer to the Series Views Compatibility document.