Drill Down
- 10 minutes to read
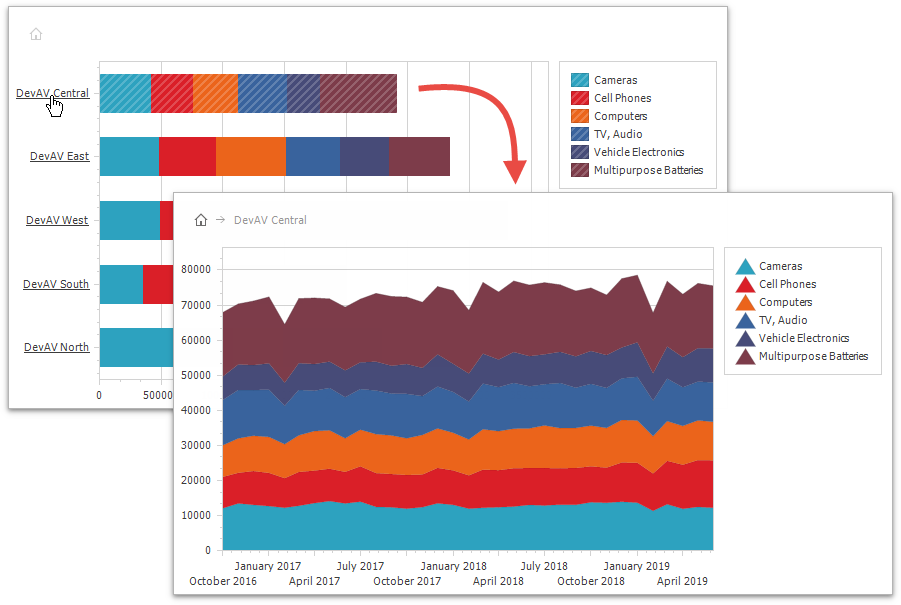
The Drill Down functionality allows you to reveal additional details when the Chart Control summarizes its data source. For example, a series point of a chart that displays annual sales grouped by category can be expanded to a chart that displays sale dynamics by product.
Note that the Chart Control uses the Breadcrumbs element to display detail levels through which end-users can navigate. Refer to the Breadcrumbs topic for more information about this element.
How to: Configure the Drill Down
The Chart Control utilizes the Nested Series Templates to display detail data. Each series template can store up to three direct child templates that specify detail data representation. All series templates use ChartControl.DataSource, but detailed templates obtain filtered data. The following list enumerates all child template types and explains data received by a detailed template.
Important
The Drill Down only supports series generated by series templates.
Note
- The argument field is the data member field whose name is the series template’s SeriesBase.ArgumentDataMember property value.
- The series field is the data member field whose name is the series template’s SeriesTemplate.SeriesDataMember property value.
Drill Down to Argument
The Chart uses the SeriesTemplate.ArgumentDrillTemplate template to reveal detail data when an end-user clicks an argument axis label. Detail data contains all data items that include an argument field value equaling the clicked argument value.
The following code demonstrates how to configure this template.
// In the Form's Load event handler.
SeriesTemplate argumentDrillTemplate = new SeriesTemplate();

List<SaleItem> data = SaleItem.GetTotalIncome();
chartControl.DataSource = data;
chartControl.SeriesTemplate.SeriesDataMember = "Category";
chartControl.SeriesTemplate.ArgumentDataMember = "Company";
chartControl.SeriesTemplate.QualitativeSummaryOptions.SummaryFunction = "SUM([Income])";
chartControl.SeriesTemplate.View = new StackedBarSeriesView();
chartControl.SeriesTemplate.ArgumentDrillTemplate = argumentDrillTemplate;

argumentDrillTemplate.SeriesDataMember = "Category";
argumentDrillTemplate.ArgumentDataMember = "OrderDate";
argumentDrillTemplate.View = new StackedAreaSeriesView();
argumentDrillTemplate.DateTimeSummaryOptions.MeasureUnit = DateTimeMeasureUnit.Month;
argumentDrillTemplate.DateTimeSummaryOptions.UseAxisMeasureUnit = false;
argumentDrillTemplate.DateTimeSummaryOptions.SummaryFunction = "SUM([Income])";
Note
A complete sample project is available on GitHub at How to: Create a Drill-Down Chart.
The code snippet above uses the following properties.
| Symbol | Description |
|---|---|
| ChartControl.SeriesTemplate | Returns the series template the chart uses to generate its series. |
| SeriesTemplate.ArgumentDrillTemplate | Gets or sets the series template that the Chart Control uses to generate detailed series when the Control should display a data slice filtered by an argument. |
Drill Down to Series
The SeriesTemplate.SeriesDrillTemplate template specifies how the Chart Control displays detail data when end-users click a series generated by the master template. Detail data contains all data items that include a series field value equaling the selected series identifier.
The following code demonstrates how to configure this template.
// In the Form's Load event handler.
SeriesTemplate seriesDrillTemplate = new SeriesTemplate();

List<SaleItem> data = SaleItem.GetTotalIncome();
chartControl.DataSource = data;
chartControl.SeriesTemplate.SeriesDataMember = "Category";
chartControl.SeriesTemplate.ArgumentDataMember = "Company";
chartControl.SeriesTemplate.QualitativeSummaryOptions.SummaryFunction = "SUM([Income])";
chartControl.SeriesTemplate.View = new StackedBarSeriesView();
chartControl.SeriesTemplate.SeriesDrillTemplate = seriesDrillTemplate;

seriesDrillTemplate.SeriesDataMember = "Product";
seriesDrillTemplate.ArgumentDataMember = "Company";
seriesDrillTemplate.QualitativeSummaryOptions.SummaryFunction = "SUM([Income])";
seriesDrillTemplate.View = new StackedBarSeriesView();
Note
A complete sample project is available on GitHub at How to: Create a Drill-Down Chart.
The example uses the properties outlined below.
| Symbol | Description |
|---|---|
| ChartControl.SeriesTemplate | Returns the series template the chart uses to generate its series. |
| SeriesTemplate.SeriesDrillTemplate | Gets or sets the series template that the Chart Control uses to generate detailed series when the Control should display a data slice filtered by a series identifier. |
Drill Down to Series Point
The SeriesTemplate.SeriesPointDrillTemplate template specifies how series that display detail data when an end-user selects a series point to expand look. Detail data contains data items that the Chart Control summarizes or aggregates into the selected series point.

The following code demonstrates how to configure this template.
// In the Form's Load event handler.
SeriesTemplate seriesPointDrillTemplate = new SeriesTemplate();

List<SaleItem> data = SaleItem.GetTotalIncome();
chartControl.DataSource = data;
chartControl.SeriesTemplate.SeriesDataMember = "Category";
chartControl.SeriesTemplate.ArgumentDataMember = "Company";
chartControl.SeriesTemplate.QualitativeSummaryOptions.SummaryFunction = "SUM([Income])";
chartControl.SeriesTemplate.View = new StackedBarSeriesView();
chartControl.SeriesTemplate.SeriesPointDrillTemplate = seriesPointDrillTemplate;

seriesPointDrillTemplate.SeriesDataMember = "Product";
seriesPointDrillTemplate.ArgumentDataMember = "OrderDate";
seriesPointDrillTemplate.DateTimeSummaryOptions.MeasureUnit = DateTimeMeasureUnit.Month;
seriesPointDrillTemplate.DateTimeSummaryOptions.UseAxisMeasureUnit = false;
seriesPointDrillTemplate.DateTimeSummaryOptions.SummaryFunction = "SUM([Income])";
seriesPointDrillTemplate.View = new StackedAreaSeriesView();
Note
A complete sample project is available on GitHub at How to: Create a Drill-Down Chart.
The code snippet above uses the following properties.
| Symbol | Description |
|---|---|
| ChartControl.SeriesTemplate | Returns the series template the chart uses to generate its series. |
| SeriesTemplate.SeriesPointDrillTemplate | Gets or sets the series template that the Chart Control uses to generate detailed series when the Control should display a data slice filtered by a series point. |
Note that any Drill Template can contain other nested templates.
The following code demonstrates how to configure the chart control to display the second nested data level.
SeriesTemplate argumentDrillTemplate = new SeriesTemplate();
SeriesTemplate secondDetailLevelTemplate = new SeriesTemplate();

// Other SeriesTemplate settings are here.
chartControl.SeriesTemplate.ArgumentDrillTemplate = argumentDrillTemplate;

// Other ArgumentDrillTemplate settings are here.
argumentDrillTemplate.SeriesDrillTemplate = secondDetailLevelTemplate;

secondDetailLevelTemplate.SeriesDataMember = "Product";
secondDetailLevelTemplate.ArgumentDataMember = "OrderDate";
secondDetailLevelTemplate.DateTimeSummaryOptions.MeasureUnit = DateTimeMeasureUnit.Month;
secondDetailLevelTemplate.DateTimeSummaryOptions.SummaryFunction = "SUM([Income])";
secondDetailLevelTemplate.View = new StackedAreaSeriesView();
How to: Manage Drill Down State at Runtime
The chart control provides methods that allow you to drill down/drill up to a specific detail level. Also, the chart diagram stores Drill Down Options that manage how charts behave on a click of its elements.
// In the Form's Load event handler.
chartControl.SelectionMode = ElementSelectionMode.Single;
chartControl.SeriesSelectionMode = SeriesSelectionMode.Point;

if (chartControl.Diagram is XYDiagram diagram) {
    // The following code disables the detail data reveal on click on a chart element.
    diagram.DrillDownOptions.UseMouse = false;
}

bbiDrillDownToSelectedArgument.ItemClick += this.OnDrillDownToSelectedArgumentBarItemClick;
bbiDrillDownToSelectedSeries.ItemClick += this.OnDrillDownToSelectedSeriesBarItemClick;
bbiDrillDownToSelectedSeriesPoint.ItemClick += this.OnDrillDownToSelectedSeriesPointBarItemClick;
bbiDrillUp.ItemClick += this.OnDrillUpBarItemClick;
// ...

// Ribbon Items' Click handlers.
private void OnDrillDownToSelectedArgumentBarItemClick(object sender, ItemClickEventArgs e) {
    if (chartControl.SelectedItems.Count == 0) return;
    SaleItem item = (SaleItem)chartControl.SelectedItems[0];
    chartControl.DrillDownToArgument(item.Company);
}
private void OnDrillDownToSelectedSeriesBarItemClick(object sender, ItemClickEventArgs e) {
    if (chartControl.SelectedItems.Count == 0) return;
    SaleItem item = (SaleItem)chartControl.SelectedItems[0];
    chartControl.DrillDownToSeries(item.Category);
}
private void OnDrillDownToSelectedSeriesPointBarItemClick(object sender, ItemClickEventArgs e) {
    if (chartControl.SelectedItems.Count == 0) return;
    SaleItem item = (SaleItem)chartControl.SelectedItems[0];
    chartControl.DrillDownToSeriesPoint(item);
}
private void OnDrillUpBarItemClick(object sender, ItemClickEventArgs e) {
    chartControl.DrillUp();
}
The following table contains the chart control’s methods that manage the Drill Down State.
| Method | Description |
|---|---|
| XYDiagram.DrillDownOptions | Returns mouse actions and hotkey settings for the Drill Down feature. |
| DrillDownOptions.UseMouse | Gets or sets the value that specifies whether an end user can use the mouse to select the point or series to show detail information. |
| DrillDownOptions.UseKeyboard | Gets or sets the value that specifies whether an end user can use the keyboard to drill down in the chart. |
| ChartControl.DrillDownToArgument | Drills down to the passed argument if the actual series template has the SeriesTemplate.ArgumentDrillTemplate specified. |
| ChartControl.DrillDownToSeries | Drills down to a series with the passed series ID if the actual series template has the SeriesTemplate.SeriesDrillTemplate specified. |
| ChartControl.DrillDownToSeriesPoint | Drills down to the passed series point if the actual series template has the SeriesTemplate.SeriesPointDrillTemplate specified. |
| ChartControl.DrillUp | Drills up if the actual series template is not root (ChartControl.SeriesTemplate) template. |
| BarButtonItem.ItemClick | Occurs when the current item is clicked. |
Important
The DrillDownTo… methods do not change the drill down state if:
- the actual series template does not have the corresponding nested template specified;
- the data source does not contain a value passed as a method’s parameter as an argument field value/series field value/data object.
How to: Handle And Prevent Drill Down State Change
The Chart Control provides the ChartControl.DrillDownStateChanging event that allows you to check the data level and prevent revealing or concealing the detail level, and the ChartControl.DrillDownStateChanged event that allows you to customize the chart’s diagram with respect to the current data level.
chartControl.DrillDownStateChanged += this.OnChartControlDrillDownStateChanged;
chartControl.DrillDownStateChanging += this.OnChartControlDrillDownStateChanging;

private void OnChartControlDrillDownStateChanging(object sender, DrillDownStateChangingEventArgs e) {
    if (e.States.Length != 0) {
        object categoryValue = null;
        if (e.States.Last().Parameters.TryGetValue("Category", out categoryValue)) {
            int seriesIndex = chartControl.Series.IndexOf(chartControl.Series[(string)categoryValue]);
            int colorIndex = seriesIndex % chartControl.PaletteRepository[chartControl.PaletteName].Count + 1;
            chartControl.PaletteBaseColorNumber = colorIndex;
        }
        if (chartControl.Diagram is XYDiagram diagram) {
            diagram.AxisX.Label.DXFont = new DevExpress.Drawing.DXFont("Tahoma", 8.25f, DevExpress.Drawing.DXFontStyle.Regular);
        }
    } else {
        chartControl.PaletteBaseColorNumber = 0;
        if (chartControl.Diagram is XYDiagram diagram) {
            diagram.AxisX.Label.DXFont = new DevExpress.Drawing.DXFont("Tahoma", 8.25f, DevExpress.Drawing.DXFontStyle.Underline);
        }
    }
}
private void OnChartControlDrillDownStateChanged(object sender, DrillDownStateChangedEventArgs e) {
    if (!(chartControl.Diagram is XYDiagram diagram)) return;
    if (e.States.Length == 0) {
        diagram.Rotated = true;
        return;
    }
    diagram.Rotated = IsDrillToSeriesFromHome(e.States);
}
private bool IsDrillToSeriesFromHome(DrillDownItem[] drillDownItems) {
    if (drillDownItems.Length != 1) return false;
    IReadOnlyDictionary<string, object> drillDownParams = drillDownItems[0].Parameters;
    if (drillDownParams.Count != 1) return false;
    return drillDownParams.ContainsKey("Category");
}
The following table contains classes and members that allow you to manage the drill down state change.
| Symbol | Description |
|---|---|
| ChartControl.DrillDownStateChanging | Occurs before the Chart Control’s drill down state is changed. |
| DrillDownStateChangingEventArgs | Provides data for the ChartControl.DrillDownStateChanging (WebChartControl.DrillDownStateChanging, or ChartControlSettings.DrillDownStateChanging) event. |
| ChartControl.DrillDownStateChanged | Occurs when the Chart Control’s drill down state is changed. |
| DrillDownStateChangedEventArgs | Provides data for the ChartControl.DrillDownStateChanged (WebChartControl.DrillDownStateChanged, or ChartControlSettings.DrillDownStateChanged) event. |