Totals
- 4 minutes to read
The Pivot Grid calculates summary values (totals) and displays them as additional columns or rows. The following totals are supported:
Automatic Totals
The automatic totals can be divided into two types:
Row/column totals display sub-totals calculated for outer row/column fields.
- Row/column grand totals display summary totals calculated against all the rows/columns.

The automatic totals are calculated using a summary function the corresponding data field specifies.
The table below lists the common members that configure automatic totals:
| Member | Description |
|---|---|
| PivotGridField.ShowTotals | Gets or sets whether automatic totals that correspond to the current data field are visible. This is a dependency property. |
| PivotGridControl.ShowRowTotals | Gets or sets whether to display Row Totals. |
| PivotGridControl.ShowColumnTotals | Gets or sets whether to display Column Totals. |
| PivotGridControl.ColumnTotalsLocation | Gets or sets the column totals‘ location. This is a dependency property. |
| PivotGridControl.RowTotalsLocation | Gets or sets the location of row totals. This is a dependency property. |
| PivotGridControl.ShowColumnGrandTotals | Gets or sets whether to display Row Grand Totals. |
| PivotGridControl.ShowRowGrandTotals | Gets or sets whether to display row grand totals. |
| PivotGridControl.ShowTotalsForSingleValues | Gets or sets whether automatic totals are displayed for the field values which contain a single nesting field value. |
| PivotGridControl.ShowGrandTotalsForSingleValues | Gets or sets whether grand totals are displayed when the control lists a single value of an outer column field or row field along its left or top edge. |
Use custom totals to calculate totals using a different summary function, or to calculate multiple subtotals.
Custom Totals
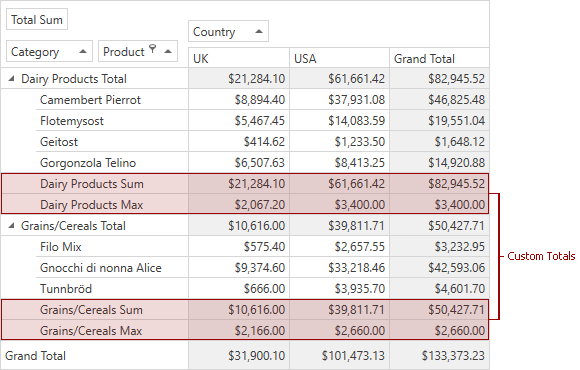
You may need to manually specify how many and what type of totals to display for each field. The custom totals replace automatic totals and can be calculated using various aggregation functions like Sum, Min, Max, Average, etc. The number of totals depends on how many items you add to the field’s custom total collection.
For example, the image below shows the Category field displaying Sum and Max totals:
The code below creates the layout as in the image above:
using DevExpress.Xpf.PivotGrid;

// Gets a reference to the CategoryName field.
PivotGridField field = pivotGridControl1.Fields["CategoryName"];
pivotGridControl1.BeginUpdate();
try {
   // Clears the custom total collection.
   field.CustomTotals.Clear();
   // Adds items to the custom total collection with
   // the specified summary types.
   field.CustomTotals.Add(FieldSummaryType.Sum);
   field.CustomTotals.Add(FieldSummaryType.Max);
   // Makes the custom totals visible for this field.
   field.TotalsVisibility = FieldTotalsVisibility.CustomTotals;
}
finally {
   pivotGridControl1.EndUpdate();
}
You can set the same layout in XAML as well:
<dxpg:PivotGridControl x:Name="pivotGridControl1" DataSource="{Binding Data, Source={StaticResource TypedSimpleSource}}">
    <dxpg:PivotGridControl.Fields>
        <dxpg:PivotGridField Area="RowArea" Caption="Category" FieldName="CategoryName"
                             AreaIndex="0" TotalsVisibility="CustomTotals">
            <dxpg:PivotGridField.CustomTotals>
                <dxpg:PivotGridCustomTotal SummaryType="Sum" />
                <dxpg:PivotGridCustomTotal SummaryType="Max" />
            </dxpg:PivotGridField.CustomTotals>
        </dxpg:PivotGridField>
        <dxpg:PivotGridField Area="ColumnArea" FieldName="Country" AreaIndex="0"/>
        <dxpg:PivotGridField Area="DataArea" FieldName="Extended Price" AreaIndex="0" Caption="Total Sum"/>
        <dxpg:PivotGridField Area="RowArea" Caption="Product" FieldName="ProductName" AreaIndex="1"/>
    </dxpg:PivotGridControl.Fields>
</dxpg:PivotGridControl>
The following table lists the members you can use to configure custom totals:
| Member | Description |
|---|---|
| PivotGridField.TotalsVisibility | Gets or sets whether to display totals for the current field when it is in the Column Header Area or Row Header Area and if so, whether they are automatic or custom. This is a dependency property. |
| PivotGridField.CustomTotals | Gets the current field’s custom total collection. |
| PivotGridField.SummaryType | Gets or sets the type of the summary function which is calculated against the current data field. This is a dependency property. |
| PivotGridControl.ShowCustomTotalsForSingleValues | Gets or sets whether custom totals are displayed for the field values which contain a single nesting field value. |
Running Totals
Running totals allow you to calculate cumulative values that correspond to the specified column or row fields. For instance, in the PivotGridControl below, running totals are enabled for the Quarter field:

In the result, the PivotGrid control in the image below displays cumulative sales for each quarter over a two-year period:

Note that cumulative values depend on the values’ order. End-users can change the order using sorting, grouping or filtering.
You can specify whether running totals are calculated independently within individual groups, or for the entire PivotGrid. In the image below, running totals for the Quarter field are calculated independently for each year (cross-group variation is disabled):

The table below lists the members you can use to configure running totals:
| Member | Description |
|---|---|
| PivotGridField.RunningTotal | Gets or sets whether Running totals are calculated for values in the Data Area that correspond to the current column or row field. This is a dependency property. |
| PivotGridControl.AllowCrossGroupVariation | Gets or sets whether summary variations and running totals are calculated independently within individual groups, or throughout the Pivot Grid. This is a dependency property. |