Grouping
- 3 minutes to read
This article describes how to group values of a Pivot Grid’s column and row fields bound to data source columns. These techniques are applicable in Optimized and Server data processing modes.
Use PivotGridField.GroupInterval for Legacy or LegacyOptimized data processing mode.
Grouping Overview
Pivot Grid allows you to group field values into bigger categories (ranges). For example, values of a column/row field that displays date/time data can be grouped by year, month, quarter, and so on. Numeric values can be grouped into numeric ranges, and string values can be grouped by the initial character(s) of the values.
Grouping is not supported in OLAP mode.
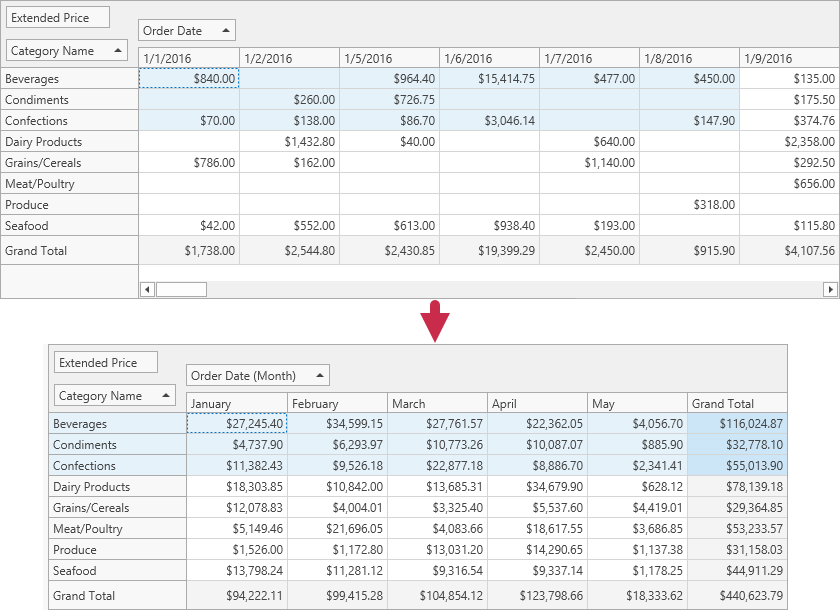
The following image demonstrates how the Pivot Grid groups values of the Order Date column field by month:
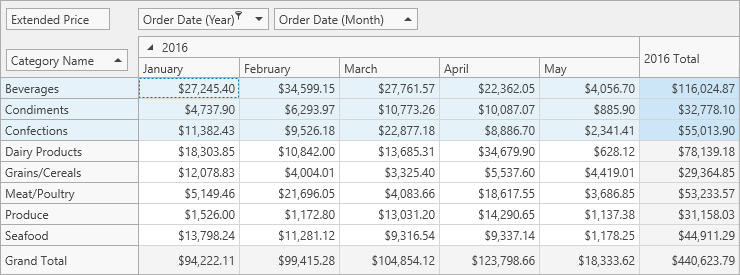
You can bind multiple Pivot Grid fields to the same data source field, and group values of these Pivot Grid fields independently of each other. The image below shows two column fields that are bound to the Order Date data source field, and grouped by years and months, respectively.
To group values of column or row fields, set the field’s group interval (DataSourceColumnBinding.GroupInterval).
Group Date-Time Values
When you group date-time field values, you can set the GroupInterval property to one of the following options:
- Date
- DateDay
- DateDayOfWeek
- DateDayOfYear
- DateWeekOfMonth
- DateWeekOfYear
- DateMonth
- DateQuarter
- DateYear
- YearAge
- MonthAge
- WeekAge
- DayAge
- Hour
- Minute
- Second
- DateMonthYear
- DateQuarterYear
- DateHour
- DateHourMinute
- DateHourMinuteSecond
- DateWeekYear
You can use the DataSourceColumnBinding.GroupIntervalNumericRange property to specify the length of the following intervals:
- YearAge
- MonthAge
- WeekAge
- DayAge
Group Numeric Values
Set the GroupInterval property to Numeric to group numeric values. Use the GroupIntervalNumericRange property to specify the length of the intervals. For instance, if the GroupIntervalNumericRange property is set to 100, the values are combined into the following intervals: 0-100, 101-200, 201-300, and so on.
Group String Values (Alphabetically)
String values can be combined into groups alphabetically by the first letter. For this, set the DataSourceColumnBindingBase.GroupInterval property to Alphabetical.
Custom Group Intervals
You can also implement custom group intervals. To do this, assign a calculated expression to a field as follows:
- Create a Pivot Grid field.
- Create an ExpressionDataBinding instance.
- Initialize the
ExpressionDataBindingobject with an expression that calculates aggregated field values. You can address Pivot Grid fields in this expression by their names (Name). - Assign the created object to the field’s DataBinding property.
Handle the PivotGridControl.CustomGroupInterval event in Legacy and LegacyOptimized modes.
Example: How to Group Date-Time Values
This example shows how to group date-time values.
<Window x:Class="HowToBindToMDB.MainWindow"
        xmlns="http://schemas.microsoft.com/winfx/2006/xaml/presentation"
        xmlns:x="http://schemas.microsoft.com/winfx/2006/xaml"
        xmlns:dxpg="http://schemas.devexpress.com/winfx/2008/xaml/pivotgrid"
        Title="MainWindow" Height="350" Width="525"  Loaded="Window_Loaded">
    <Grid>
        <dxpg:PivotGridControl Name="pivotGridControl1" DataProcessingEngine="Optimized">
            <dxpg:PivotGridControl.Fields>
                <dxpg:PivotGridField Name="fieldYear" Area="RowArea" Caption="Year">
                    <dxpg:PivotGridField.DataBinding>
                        <dxpg:DataSourceColumnBinding ColumnName="OrderDate" GroupInterval="DateYear"/>
                    </dxpg:PivotGridField.DataBinding>
                </dxpg:PivotGridField>
                <dxpg:PivotGridField Name="fieldQuarter" Area="RowArea" Caption="Quarter"
                                     ValueFormat="Qtr {0}" >
                    <dxpg:PivotGridField.DataBinding>
                        <dxpg:DataSourceColumnBinding ColumnName="OrderDate" GroupInterval="DateQuarter"/>
                    </dxpg:PivotGridField.DataBinding>
                </dxpg:PivotGridField>
                <dxpg:PivotGridField Name="fieldMonth" Area="RowArea" Caption="Month" >
                    <dxpg:PivotGridField.DataBinding>
                        <dxpg:DataSourceColumnBinding ColumnName="OrderDate" GroupInterval="DateMonth"/>
                    </dxpg:PivotGridField.DataBinding>
                </dxpg:PivotGridField>
                <dxpg:PivotGridField Name="fieldExtendedPrice" Area="DataArea" CellFormat="c0" >
                    <dxpg:PivotGridField.DataBinding>
                        <dxpg:DataSourceColumnBinding ColumnName="Extended Price"/>
                    </dxpg:PivotGridField.DataBinding>
                </dxpg:PivotGridField>
            </dxpg:PivotGridControl.Fields>
        </dxpg:PivotGridControl>
    </Grid>
</Window>
Example: Custom Group Intervals
This example shows how to implement custom group intervals in Pivot Grid to group axis values.
<Window xmlns:dxpg="http://schemas.devexpress.com/winfx/2008/xaml/pivotgrid"
xmlns="http://schemas.microsoft.com/winfx/2006/xaml/presentation"
xmlns:x="http://schemas.microsoft.com/winfx/2006/xaml"
Title="MainWindow" Height="350" Width="525"
x:Class="HowToBindToMDB.MainWindow"
Loaded="Window_Loaded">
<Grid>
<dxpg:PivotGridControl DataProcessingEngine="Optimized"
HorizontalAlignment="Left" Name="pivotGridControl1"
VerticalAlignment="Top">
<dxpg:PivotGridControl.Fields>
<dxpg:PivotGridField Name="fieldProductGroup" Area="RowArea"
Caption="Product Group">
<dxpg:PivotGridField.DataBinding>
<dxpg:ExpressionDataBinding Expression="Iif(Substring([fieldProductName], 0, 1) < 'F', 'A-E', Substring([fieldProductName], 0, 1) < 'T', 'F-S', 'T-Z')" />
</dxpg:PivotGridField.DataBinding>
</dxpg:PivotGridField>
<dxpg:PivotGridField Name="fieldProductName" Area="RowArea"
Caption="Product Name" >
<dxpg:PivotGridField.DataBinding>
<dxpg:DataSourceColumnBinding ColumnName="ProductName" />
</dxpg:PivotGridField.DataBinding>
</dxpg:PivotGridField>
<dxpg:PivotGridField Name="fieldExtendedPrice"
Area="DataArea" CellFormat="c0">
<dxpg:PivotGridField.DataBinding>
<dxpg:DataSourceColumnBinding ColumnName="Extended Price"/>
</dxpg:PivotGridField.DataBinding>
</dxpg:PivotGridField>
<dxpg:PivotGridField Name="fieldCountry"
Area="ColumnArea" >
<dxpg:PivotGridField.DataBinding>
<dxpg:DataSourceColumnBinding ColumnName="Country"/>
</dxpg:PivotGridField.DataBinding>
</dxpg:PivotGridField>
</dxpg:PivotGridControl.Fields>
</dxpg:PivotGridControl>
</Grid>
</Window>