TdxChartBarSeriesPointDrawParameters.Appearance Property
Provides access to fill and outline settings of a bar that displays the currently processed series point.
Declaration
property Appearance: TdxChartXYSeriesBarAppearance read;Property Value
| Type | Description |
|---|---|
| TdxChartXYSeriesBarAppearance | Stores Bar series View appearance settings. |
Remarks
Use Appearance.FillOptions and Appearance.StrokeOptions properties to change area fill and outline appearance of the bar that displays the currently processed series point in a Simple, Stacked, or Full-Stacked Bar View.
Refer to the TdxChartXYSeriesBarAppearance class description for detailed information on all available options.
Code Example: Customize Individual Series Bars
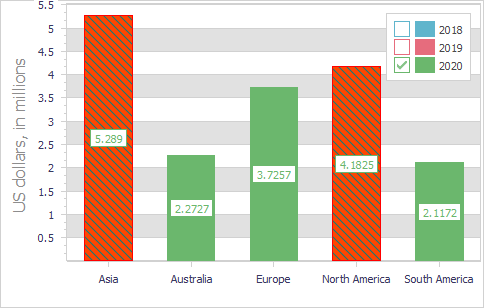
The following code example demonstrates a diagram’s OnGetSeriesPointDrawParameters event handler that changes the appearance settings of all bars that display peak values in a Simple Bar series.
procedure TMyForm.cdBarGetSeriesPointDrawParameters(Sender: TdxChartCustomDiagram;
  AArgs: TdxChartGetSeriesPointDrawParametersEventArgs);
var
  ABarDrawParameters: TdxChartBarSeriesPointDrawParameters;
  ASeries: TdxChartCustomSeries;
  AIndex: Integer;
begin
  if AArgs.SeriesPoint.Series.Caption = '2020' then
  begin
    if AArgs.DrawParameters.ClassType <> TdxChartBarSeriesPointDrawParameters then Exit;
    ABarDrawParameters := AArgs.DrawParameters as TdxChartBarSeriesPointDrawParameters;
    AIndex := AArgs.SeriesPoint.Index;
    ASeries := AArgs.SeriesPoint.Series;
    if ((AIndex = 0) and (ASeries.Points.Values[AIndex] > ASeries.Points.Values[AIndex + 1])) or
       ((AIndex > 0) and (AIndex < ASeries.Points.Count - 1) and
       (ASeries.Points.Values[AIndex] > ASeries.Points.Values[AIndex + 1]) and
        (ASeries.Points.Values[AIndex] > ASeries.Points.Values[AIndex - 1])) then
    begin
      ABarDrawParameters.Appearance.BeginUpdate;
      ABarDrawParameters.Appearance.FillOptions.Color := TdxAlphaColors.OrangeRed;
      ABarDrawParameters.Appearance.FillOptions.Mode := TdxFillOptionsMode.Hatch;
      ABarDrawParameters.Appearance.FillOptions.HatchStyle := TdxFillOptionsHatchStyle.ForwardDiagonal;
      ABarDrawParameters.Appearance.FillOptions.Color2 := TdxAlphaColors.Teal;
      ABarDrawParameters.Appearance.StrokeOptions.Color := TdxAlphaColors.Red;
      ABarDrawParameters.Appearance.StrokeOptions.Style := TdxStrokeStyle.Solid;
      ABarDrawParameters.Appearance.EndUpdate;
    end;
  end;
end;
See Also