VCL Charts: Doughnut View Tutorial. Step 1. Create a Doughnut Series and Bind it to Data
- 4 minutes to read
This step describes how to add a VCL Chart control, create a doughnut series, apply a skin to the project, add and populate a memory-based dataset, and bind the created series to dataset fields at design time.

Add a Chart Control to the Form
Drag a VCL Chart control (TdxChartControl) from the Tool Palette onto the form. Set the control’s Align property to alClient in the Object Inspector to allow the control to occupy the form’s client area.

Add and Configure a Skin Controller
The Skin Controller allows you to select a theme (a skin) for your application. The selected theme applies consistent look & feel across all DevExpress controls as well as standard forms.
Review Project Settings Related to DevExpress Skins
Make sure DevExpress skins support is enabled for the application project. Click the Project group in the main menu of your RAD Studio® IDE and select Modify Skin Options to invoke the Project Skin Options Editor.

Check Enable skin support if it is unchecked and click OK to close the Project Skin Options Editor dialog.
Add a Skin Controller to the Form
Drag a TdxSkinController component from the Tool Palette onto the form.

Apply a Skin
Make sure that the Skin Controller is selected. Set the NativeStyle property to False in the Object Inspector because the native (operating system-dependent) look & feel style has priority over skins and built-in basic styles.

Select a skin in the SkinName combo box in the Object Inspector.

For example, you can select the vector skin named Basic.

Vector skins are recommended for high-resolution environments because vector skin elements are SVG images that DevExpress controls can render at any target monitor DPI without quality losses.
Select a Color Scheme
Each vector skin ships with a set of dark and light color schemes (color palettes). You can use the SkinPaletteName property to switch between color schemes available for the currently selected vector skin.

For example, you can select the color scheme named Violet Dark.

The Chart control’s background color changes to black as a result.

Create a Simple Diagram
The Chart control can contain one or more panes called diagrams where you can display and manage series. To display a doughnut series, you need to create a simple diagram first.
Right-click the Chart control and select the Add Simple Diagram context menu item to create an empty simple diagram.

The control’s appearance does not change but now you can create a doughnut series.
Create a Doughnut Series
To create a doughnut series, right-click the Chart control and select Add Doughnut Series.

The newly created empty doughnut series is displayed in the Chart control.

Add and Populate a Dataset
Add a TdxMemData component to the form. This component is a memory-based dataset you can link to a data-aware control or a Chart control series in bound data access mode.
Change the component’s name to mdCountries.
Right-click the component and select Persistent Editor… in the context menu to invoke the dialog that allows you to manage dataset fields and records.

Follow the steps below to populate the dataset:
- Click Get Fields to load dataset fields from a file. Locate the Countries.dat file installed with DevExpress Demos. The default installation path is C:\Users\Public\Documents\DevExpress\VCL\Demos\ExpressCharts\Data\.
- Click Load… to populate dataset fields with data. Select the same file in the opened dialog.
Note
You need to install demos to use demo datasets.
The following image demonstrates the populated memory-based dataset:

Click OK to apply changes and close the Persistent Editor.
Set the TdxMemData component’s Active property to True to allow a bound control to interact with stored data.

Bind a Series to a Data Source
Add a TDataSource component that allows you to bind a dataset to a Chart series. Rename the component to dsCountries.

Configure the Data Source
Set the component’s DataSet property to mdCountries to link the data source component to the previously populated memory-based dataset.

Bind a Series to the Data Source
Double-click the Chart control to invoke the Chart Designer dialog. Note that the active skin is applied to it.

Select dxChartControl1SimpleSeries1 and rename it to Countries.
Set the DataBinding property to DB.

Expand the DataBinding node in the Object Inspector and assign the dsCountries data source to the DataSource property.

Expand the ArgumentField node and assign Country to the FieldName property.

Expand the ValueField node and assign Area to the FieldName property.

The Countries series is visible as a result.
Tip
You can press Ctrl + H to hide non-visual components that can overlap form content at design time.
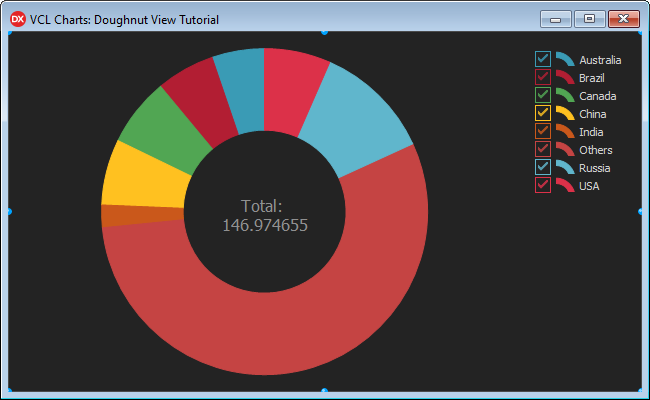
Result
The Chart control displays the Countries series with the default appearance settings. Note that the chart legend is populated with series arguments.
Next Step
The next step describes how to display and customize value and summary labels.