View3DOptions.BackWall Property
Provides access to options used to format the back wall of a 3-D chart.
Namespace: DevExpress.Spreadsheet.Charts
Assembly: DevExpress.Spreadsheet.v26.1.Core.dll
Declaration
Property Value
| Type | Description |
|---|---|
| SurfaceOptions | A SurfaceOptions object containing formatting options for the 3-D chart walls and floor. |
Property Paths
You can access this nested property as listed below:
| Object Type | Path to BackWall |
|---|---|
| ChartObject |
|
Remarks
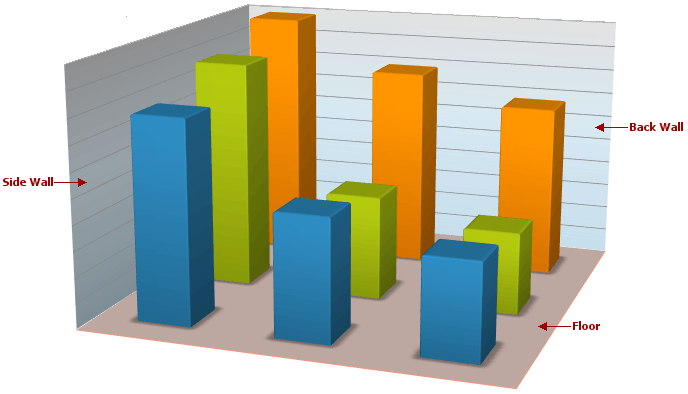
Use the BackWall property to adjust the appearance of the three-dimensional chart back wall (change the background color, specify the wall thickness and apply borders). To format the chart floor and side wall, use the View3DOptions.Floor and View3DOptions.SideWall properties, respectively.
The 3-D column chart with the colored floor, back and side walls is shown in the image below (the chart is displayed in Microsoft® Excel®).
Note
Currently, the SpeadsheetControl does not display charts with the custom back wall (the default formatting will be applied). However, display settings are loaded and stored in supported formats, and you can modify them programmatically.
Example
The example below demonstrates how to create the 3-D clustered column chart and adjust its appearance. In particular, the code specifies how to customize the chart walls and floor by using the View3DOptions.BackWall, View3DOptions.SideWall and View3DOptions.Floor properties.
Worksheet worksheet = workbook.Worksheets["chartTask5"];
workbook.Worksheets.ActiveWorksheet = worksheet;

// Create a chart and specify its location.
Chart chart = worksheet.Charts.Add(ChartType.Column3DClustered, worksheet["B2:C8"]);
chart.TopLeftCell = worksheet.Cells["F2"];
chart.BottomRightCell = worksheet.Cells["L15"];

// Specify that each data point in the series has a different color.
chart.Views[0].VaryColors = true;
// Specify the series outline.
chart.Series[0].Outline.SetSolidFill(Color.AntiqueWhite);
// Hide the legend.
chart.Legend.Visible = false;

// Specify the side wall color.
chart.View3D.SideWall.Fill.SetSolidFill(Color.FromArgb(0xDC, 0xFA, 0xDD));
// Specify the pattern fill for the back wall.
chart.View3D.BackWall.Fill.SetPatternFill(Color.FromArgb(0x9C, 0xFB, 0x9F), Color.WhiteSmoke, DevExpress.Spreadsheet.Drawings.ShapeFillPatternType.DiagonalBrick);

SurfaceOptions floorOptions = chart.View3D.Floor;
// Specify the floor color.
floorOptions.Fill.SetSolidFill(Color.FromArgb(0xFA, 0xDC, 0xF9));
// Specify the floor border.
floorOptions.Outline.SetSolidFill(Color.FromArgb(0xB4, 0x95, 0xDE));
floorOptions.Outline.Width = 1.25;