DataTableOptions.Visible Property
Gets or sets whether the data table is displayed on a chart.
Namespace: DevExpress.Spreadsheet.Charts
Assembly: DevExpress.Spreadsheet.v26.1.Core.dll
Declaration
Property Value
| Type | Description |
|---|---|
| Boolean | true, to display a data table; otherwise, false. |
Property Paths
You can access this nested property as listed below:
| Object Type | Path to Visible |
|---|---|
| ChartObject |
|
Remarks
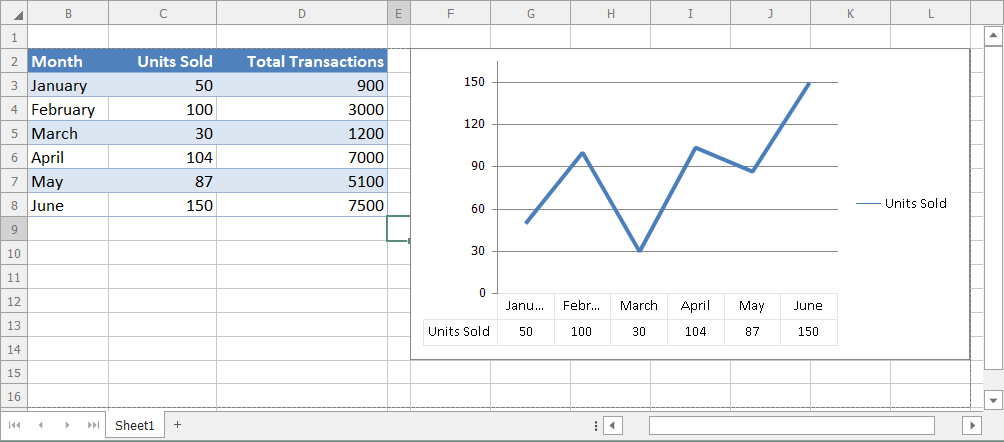
Use the Visible property to enable a data table in a chart.
Example
The following code snippet creates a line chart and displays the data table:
using DevExpress.Spreadsheet;
using DevExpress.Spreadsheet.Charts;
//...

Worksheet worksheet = workbook.Worksheets["chartTask5"];

// Create a chart and specify its location
Chart chart = worksheet.Charts.Add(ChartType.Line, worksheet["B2:C8"]);
chart.TopLeftCell = worksheet.Cells["F2"];
chart.BottomRightCell = worksheet.Cells["L14"];

// Display a data table
// and hide legend keys
DataTableOptions dataTableOptions = chart.DataTable;
dataTableOptions.Visible = true;
dataTableOptions.ShowLegendKeys = false;
Related GitHub Examples
The following code snippets (auto-collected from DevExpress Examples) contain references to the Visible property.
Note
The algorithm used to collect these code examples remains a work in progress. Accordingly, the links and snippets below may produce inaccurate results. If you encounter an issue with code examples below, please use the feedback form on this page to report the issue.