ChartPane Class
A chart pane.
Declaration
export class ChartPane extends SerializableModelRemarks
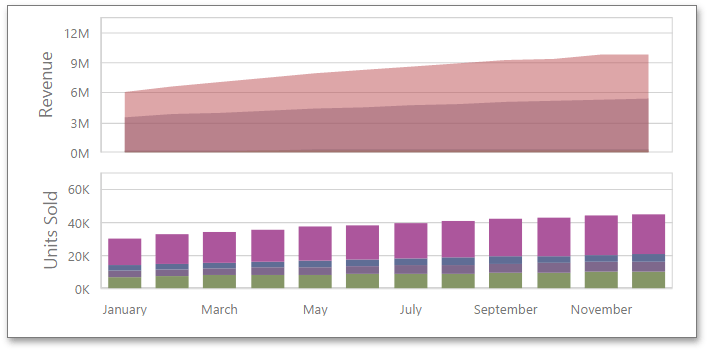
The ChartPane instances represent chart panes - rectangular areas where series are plotted. A single chart dashboard item can have several panes.
Each pane has its own Y-axis and displays a specific set of series. All panes in a chart share the same X-axis.
The ChartPane objects provide access to the collection of series plotted on this pane (ChartPane.series) and settings of the Y-axis (ChartPane.primaryAxisY).
Use the ChartItem.panes property to access the collection of panes that constitute the ChartItem.
Inherited Members
Inheritance
constructor(dataItemProvider)
Initializes a new instance of the ChartPane class.
Declaration
constructor(
    dataItemProvider: DevExpress.Dashboard.Model.DataDashboardItem,
    dashboardItemJSON?: any,
    serializer?: DevExpress.Analytics.Utils.ModelSerializer
)
Parameters
| Name | Type | Description |
|---|---|---|
| dataItemProvider | DataDashboardItem | |
| dashboardItemJSON | any | A JSON object used for dashboard deserialization. Do not pass this parameter directly. |
| serializer | ModelSerializer | An object used for dashboard deserialization. Do not pass this parameter directly. |
Properties
createSeriesByViewType Property
Declaration
createSeriesByViewType: (seriesViewType: string) => DevExpress.Dashboard.Model.ChartSeriesProperty Value
| Type |
|---|
| (seriesViewType: string) => ChartSeries |
name Property
Specifies the name of the current pane.
Declaration
name: ko.Observable<string>Property Value
| Type | Description |
|---|---|
| Observable<string> | A string that specifies the name of the current pane. |
primaryAxisY Property
Gets the primary Y-axis displayed within the current pane.
Declaration
primaryAxisY: DevExpress.Dashboard.Model.ChartAxisYProperty Value
| Type | Description |
|---|---|
| ChartAxisY | A ChartAxisY object that is the primary Y-axis displayed within the current pane. |
Remarks
Use the primaryAxisY property to access settings of the primary Y-axis displayed within the current pane. These settings include the visibility of the axis, the axis title, etc.
secondaryAxisY Property
Gets the secondary Y-axis displayed within the current pane.
Declaration
secondaryAxisY: DevExpress.Dashboard.Model.ChartSecondaryAxisYProperty Value
| Type | Description |
|---|---|
| ChartSecondaryAxisY | A ChartSecondaryAxisY object that is the secondary Y-axis displayed within the current pane. |
Remarks
Use the secondaryAxisY property to access settings of the secondary Y-axis displayed within the current pane. These settings include the visibility of the axis, the axis title, etc.
series Property
Specifies the collection of series plotted in this pane.
Declaration
series: ko.ObservableArray<DevExpress.Dashboard.Model.ChartSeries>Property Value
| Type | Description |
|---|---|
| ObservableArray<ChartSeries> | A collection of ChartSeries descendants that represent series plotted in this pane. |
Remarks
Use the series collection to introduce new series in the Chart dashboard item.
To do this, create instances of the appropriate ChartSeries descendants and add them to the series collection.
Methods
dispose Method
Disposes of all resources associated with this ChartPane.
Declaration
dispose(): voidgetInfo Method
For internal use.
Declaration
getInfo(): DevExpress.Analytics.Utils.ISerializationInfoArrayReturns
| Type | Description |
|---|---|
| ISerializationInfoArray | An array of objects that provide serialization info. |