ChartAxisY Class
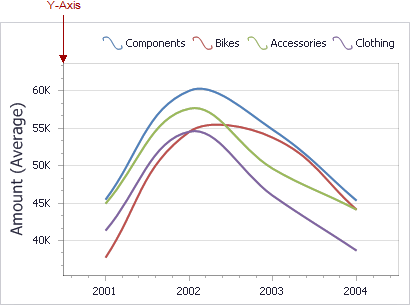
The chart’s Y-axis.
Declaration
export class ChartAxisY extends ChartAxisRemarks
The ChartAxisY class provides various settings that allow you to specify the axis visibility (ChartAxis.visible) and title (ChartAxis.title), as well as define whether the axis zero level should always be shown (ChartAxisY.alwaysShowZeroLevel).
Use the ChartPane.primaryAxisY property to access the ChartAxisY instance.
Use the ChartItem.axisX property to access the ChartAxisX instance that is the chart’s X-axis.
Inheritance
constructor
Initializes a new instance of the ChartAxisY class.
Declaration
constructor(
    JSON?: any,
    serializer?: DevExpress.Analytics.Utils.ModelSerializer
)
Parameters
| Name | Type | Description |
|---|---|---|
| JSON | any | A JSON object used for dashboard deserialization. Do not pass this parameter directly. |
| serializer | ModelSerializer | An object used for dashboard deserialization. Do not pass this parameter directly. |
Properties
alwaysShowZeroLevel Property
Specifies whether the zero level of the Y-axis should always be visible.
Declaration
alwaysShowZeroLevel: ko.Observable<boolean>Property Value
| Type | Description |
|---|---|
| Observable<boolean> | true, to always show the zero level of the Y-axis; otherwise, false. |
Remarks
If the alwaysShowZeroLevel property is set to false, the chart dashboard item displays the range of the Y-axis that currently contains data points.
If the alwaysShowZeroLevel property is set to true, the displayed range of the Y-axis always includes the zero level.
logarithmic Property
Specifies whether the axis should display its numerical values using a logarithmic scale.
Declaration
logarithmic: ko.Observable<boolean>Property Value
| Type | Description |
|---|---|
| Observable<boolean> | true, if the logarithmic scale should be used; otherwise, false. |
Remarks
Use the ChartAxisY.logarithmicBase property to specify a logarithmic base when the logarithmic property is enabled.
logarithmicBase Property
Specifies a value specifying a logarithmic base when using a logarithmic scale.
Declaration
logarithmicBase: ko.Observable<DevExpress.Dashboard.Model.LogarithmicBase>Property Value
| Type | Description |
|---|---|
| Observable<LogarithmicBase> | A js-DevExpress.Dashboard.Model.LogarithmicBase value that specifies the logarithmic base. |
Remarks
The logarithmicBase property is in effect when the ChartAxisY.logarithmic property is enabled.
showGridLines Property
Specifies whether to show grid lines for a Y-axis.
Declaration
showGridLines: ko.Observable<boolean>Property Value
| Type | Description |
|---|---|
| Observable<boolean> | true, to show grid lines for a Y-axis; otherwise, false. |
Remarks
The grid lines are used to improve the readability of a chart’s visual data.
Methods
getInfo Method
For internal use.
Declaration
getInfo(): DevExpress.Analytics.Utils.ISerializationInfoArrayReturns
| Type | Description |
|---|---|
| ISerializationInfoArray | An array of objects that provide serialization info. |