ChartCalculatedField.Expression Property
Gets or sets an expression the calculated field uses to evaluate its values.
Namespace: DevExpress.XtraCharts
Assembly: DevExpress.XtraCharts.v20.1.dll
NuGet Packages: DevExpress.Charts, DevExpress.WindowsDesktop.Charts
Declaration
[XtraChartsLocalizableCategory(XtraChartsCategory.Data)]
public string Expression { get; set; }Property Value
| Type | Description |
|---|---|
| String | A string that represents an expression written in Criteria Language. |
Remarks
An expression is a string that, when parsed and processed, evaluates a value. Expressions can consist of column/field names in brackets, constants, operators, and functions. For information on expression syntax, refer to Criteria Language Syntax.
You can use the Expression Editor to create expressions at design time or specify expressions in code at runtime.
Example
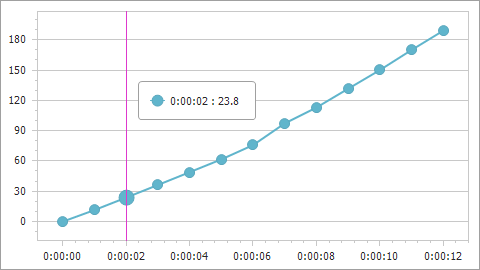
The following example shows how to create a calculated field and then use this field as a data source for a series. The field’s values are calculated by the following expression: [Time.Seconds] * [Velocity].
using DevExpress.XtraCharts;
using System;
using System.Collections.Generic;
using System.Windows.Forms;

namespace CalculatedFieldExample {
    public partial class Form1 : Form {
        //...
        private void Form1_Load(object sender, EventArgs e) {
            chartControl1.DataSource = GetDataPoints();

            ChartCalculatedField calcField = new ChartCalculatedField();
            calcField.Expression = "[Time.Seconds] * [Velocity]";
            calcField.FieldType = ChartCalculatedFieldType.Double;
            calcField.Name = "Displacement";
            chartControl1.CalculatedFields.Add(calcField);

            Series series = new Series("series", ViewType.Line);
            series.ArgumentDataMember = "Time";
            series.ValueDataMembers.AddRange("Displacement");
            chartControl1.Series.Add(series);
            XYDiagram diagram = chartControl1.Diagram as XYDiagram;
            diagram.AxisX.TimeSpanScaleOptions.MeasureUnit = TimeSpanMeasureUnit.Second;
            diagram.AxisY.WholeRange.AlwaysShowZeroLevel = false;
        }
        public List<DataPoint> GetDataPoints() {
            List<DataPoint> dataPoints = new List<DataPoint>() {
                new DataPoint (new TimeSpan(0, 0, 0), 10),
                new DataPoint (new TimeSpan(0, 0, 1), 11.46),
                new DataPoint (new TimeSpan(0, 0, 2), 11.90),
                //...
                // Other data points here.
                // ...
                new DataPoint (new TimeSpan(0, 0, 12), 15.756)
            };
            return dataPoints;
        }
    }
    public class DataPoint {
        public TimeSpan Time { get; set; }
        public double Velocity { get; set; }
        public DataPoint(TimeSpan time, double velocity) {
            this.Time = time;
            this.Velocity = velocity;
        }
    }
}