Series Class
Represents an individual series within a chart control.
Namespace: DevExpress.XtraCharts
Assembly: DevExpress.XtraCharts.v20.1.dll
NuGet Packages: DevExpress.Charts, DevExpress.WindowsDesktop.Charts
Declaration
public class Series :
    SeriesBase,
    IDisposable,
    ISupportInitialize,
    ICustomTypeDescriptor,
    ISeries,
    ISeriesBase,
    ISeriesPointFactory,
    IXtraSerializable,
    ISupportID,
IDataSourceChangedEventHandlerProviderRelated API Members
The following members return Series objects:
| Library | Related API Members |
|---|---|
| Cross-Platform Class Library | CrosshairElement.Series |
| CrosshairLegendElementBase.Series | |
| CustomDrawSeriesEventArgsBase.Series | |
| CustomizePieTotalLabelEventArgs.Series | |
| PieSeriesPointExplodedEventArgs.Series | |
| PivotGridSeriesPointsExcludedEventArgs.Series | |
| SeriesCollection.Item[Int32] | |
| SeriesCollection.Item[String] | |
| SeriesPointCollection.Owner | |
| WinForms Controls | ChartControl.GetSeriesByName(String) |
| Reporting | XRChart.GetSeriesByName(String) |
| ASP.NET Web Forms Controls | WebChartControl.GetSeriesByName(String) |
Remarks
The Series class defines the functionality of individual series objects within a chart control.
In addition to the settings inherited from the base SeriesBase class, the Series class exposes the properties which allow you to define a series name (Series.Name), specify its data source (Series.DataSource) and customize its data points (Series.Points).
The most important characteristic of a series is its view type, which determines the particular visual representation of data.
Series can be created either at design time or in code, in the following two ways.
- Manually, by adding individual items to the ChartControl.Series collection, represented by an object of the SeriesCollection type. This collection allows you to manipulate its items by adding new or removing existing series objects. Then, a particular Series object can be accessed within the collection using indexer notation (see the SeriesCollection.Item property).
- Automatically, based on the chart’s data source, by specifying common series settings via the ChartControl.SeriesTemplate property. Note that series created in this way are not stored in the ChartControl.Series collection.
For more information on using both these approaches, refer to Create a Series Manually .
Note that the sequence in which series are drawn corresponds to the order they have in the collection.
For more information, refer to Series.
Example
This example demonstrates how to create a ChartControl with two series of the SideBySideBarSeriesView type at runtime:
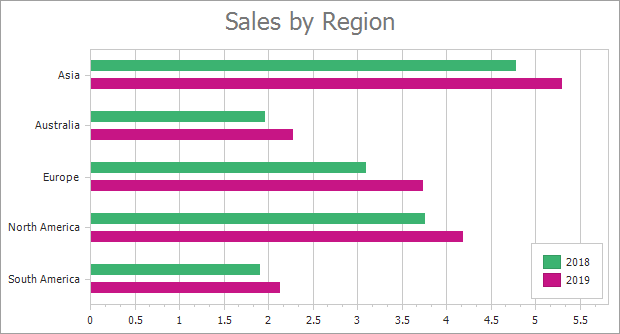
- Add a chart to the WinForms project and specify the chart’s data source.
- Create two series and add them to the chart.
- Specify data members for the series.
- Configure series view settings.
using DevExpress.XtraCharts;
using System;
using System.ComponentModel;
using System.Drawing;
using System.Windows.Forms;
// ...

namespace SideBySideBar2D {
    public partial class Form1 : Form {
        public Form1() {
            InitializeComponent();
        }
        private void Form1_Load(object sender, EventArgs e) {
            // Create an empty chart.
            ChartControl chart = new ChartControl();

            // Bind a chart to a data source.
            chart.DataSource = DataPoint.GetDataPoints();

            // Create the first series and specify its data members.
            Series series1 = new Series("2018", ViewType.Bar);
            series1.ArgumentDataMember = "Region";
            series1.ValueDataMembers.AddRange("Value1");

            // Create the second series and specify its data members.
            Series series2 = new Series("2019", ViewType.Bar);
            series2.ArgumentDataMember = "Region";
            series2.ValueDataMembers.AddRange("Value2");

            // Add series to the chart.
            chart.Series.AddRange(new Series[] { series1, series2 });

            // Change the first series's view settings.
            SideBySideBarSeriesView view1 = series1.View as SideBySideBarSeriesView;
            // The BarDistance, BarDistanceFixed, and EqualBarWidth property values are synchronized
            // in all Side-by-Side Bar Series in a ChartControl.
            // So, you can specify them only for one series view.
            view1.BarDistance = 0.1;
            view1.BarDistanceFixed = 2;
            view1.BarWidth = 0.4;
            view1.EqualBarWidth = true;
            view1.Color = Color.MediumSeaGreen;

            // Change the second series's view settings.
            SideBySideBarSeriesView view2 = series2.View as SideBySideBarSeriesView;
            view2.BarWidth = 0.4;
            view2.Color = Color.MediumVioletRed;

            // Change the legend position.
            chart.Legend.AlignmentHorizontal = LegendAlignmentHorizontal.Right;
            chart.Legend.AlignmentVertical = LegendAlignmentVertical.Bottom;

            // Rotate the diagram.
            ((XYDiagram)chart.Diagram).Rotated = true;

            // Configure the x-axis appearance.
            ((XYDiagram)chart.Diagram).AxisX.Tickmarks.MinorVisible = false;
            ((XYDiagram)chart.Diagram).AxisX.Reverse = true;

            // Add a title to the chart.
            ChartTitle chartTitle1 = new ChartTitle();
            chartTitle1.Text = "Sales by Region";
            chart.Titles.Add(chartTitle1);

            // Add the chart to the form.
            chart.Dock = DockStyle.Fill;
            this.Controls.Add(chart);
        }
    }

    public class DataPoint {
        public string Region { get; set; }
        public double Value1 { get; set; }
        public double Value2 { get; set; }
        public DataPoint(string region, double value1, double value2) {
            this.Region = region;
            this.Value1 = value1;
            this.Value2 = value2;
        }
        public static BindingList<DataPoint> GetDataPoints() {
            BindingList<DataPoint> data = new BindingList<DataPoint> {
                new DataPoint("Asia", 4.7685, 5.289),
                new DataPoint("Australia", 1.9576, 2.2727),
                new DataPoint("Europe", 3.0884, 3.7257),
                new DataPoint("North America", 3.7477, 4.1825),
                new DataPoint("South America", 1.8945, 2.1172),
            };
            return data;
        }
    }
}