PaneLayoutDirection Enum
Lists the values that specify panes alignment direction.
Namespace: DevExpress.XtraCharts
Assembly: DevExpress.XtraCharts.v20.1.dll
NuGet Packages: DevExpress.Charts, DevExpress.WindowsDesktop.Charts
Declaration
[ResourceFinder(typeof(XtraChartsResFinder), "PropertyNamesRes")]
public enum PaneLayoutDirectionMembers
| Name | Description |
|---|---|
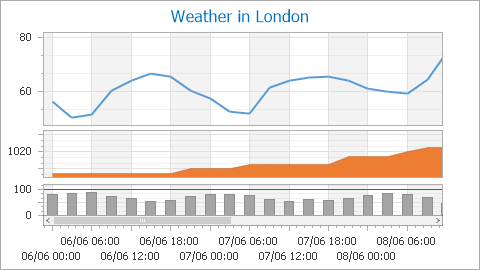
Vertical
|
Panes are aligned in the vertical direction.
|
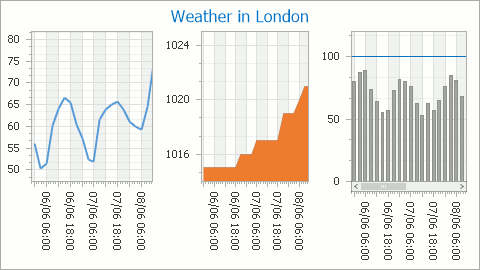
Horizontal
|
Panes are aligned in the horizontal direction.
|
Related API Members
The following properties accept/return PaneLayoutDirection values:
| Library | Related API Members |
|---|---|
| Cross-Platform Class Library | GridPaneLayout.Direction |
| WinForms Controls | GridPaneLayoutModel.Direction |
Remarks
Values listed by the PaneLayoutDirection enumeration are used to set the GridPaneLayout.Direction property.
For more information, refer to Pane Layout.
Example
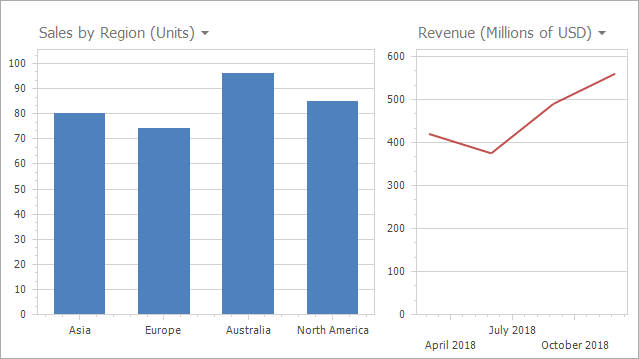
This example shows how to plot multiple series in separate panes.
Create a ChartControl object.
Create two Series objects. Populate their Points collection with SeriesPoint objects. Add both series to the ChartControl.Series collection. See the Providing Data document for more information on how to create series and populate them with data.
To add a pane in addition to the diagram’s DefaultPane, create a new XYDiagramPane and add it to the Panes collection. Use the XYDiagramSeriesViewBase.Pane property to assign the pane to a series view.
Use the following API to specify the pane title and position options:
Member Description XYDiagramPaneBase.Title Returns the pane title settings. XYDiagram2D.PaneDistance Specifies the distance between a diagram’s panes. XYDiagram2D.PaneLayout Returns the diagram’s pane layout configuration. XYDiagramPaneBase.LayoutOptions Returns settings that configure the pane’s position in the Grid Layout. To add a secondary x-axis, add a SecondaryAxisX object to the diagram’s SecondaryAxesX collection. To add a secondary y-axis, add a SecondaryAxisY object to the diagram’s SecondaryAxesY collection. To assign the axes to the view, use the AxisX and AxisY properties.
Use the following properties to customize the axis options:
Member Description Axis2D.Alignment Specifies the position of an axis relative to another primary axis. AxisBase.GridLines Gets the grid lines settings.
using System;
using System.Windows.Forms;
using DevExpress.Utils;
using DevExpress.XtraCharts;
// ...
private void OnFormLoad(object sender, EventArgs e) {
    // Create a new chart.
    ChartControl chartControl1 = new ChartControl();

    // Create two series.
    Series series1 = new Series("Series 1", ViewType.Bar);
    Series series2 = new Series("Series 2", ViewType.Line);

    // Add points to them, with their arguments different.
    series1.Points.Add(new SeriesPoint("Asia", 80));
    series1.Points.Add(new SeriesPoint("Europe", 74));
    series1.Points.Add(new SeriesPoint("Australia", 96));
    series1.Points.Add(new SeriesPoint("North America", 85));

    series2.Points.Add(new SeriesPoint(new DateTime(2018, 02, 28), 420));
    series2.Points.Add(new SeriesPoint(new DateTime(2018, 05, 31), 375));
    series2.Points.Add(new SeriesPoint(new DateTime(2018, 08, 31), 490));
    series2.Points.Add(new SeriesPoint(new DateTime(2018, 11, 30), 560));

    // Add both series to the chart.
    chartControl1.Series.AddRange(new Series[] { series1, series2 });

    // Cast the second series's view to the LineSeriesView type.
    LineSeriesView myView = (LineSeriesView)series2.View;

    // Hide the legend (optional).
    chartControl1.Legend.Visibility = DefaultBoolean.False;

    // Cast the chart's diagram to the XYDiagram type,
    // to access its axes and panes.
    XYDiagram diagram = (XYDiagram)chartControl1.Diagram;

    // Add a new additional pane to the diagram.
    diagram.Panes.Add(new XYDiagramPane("My Pane"));

    // Note that the created pane has the zero index in the collection,
    // because the existing Default pane is a separate entity.
    myView.Pane = diagram.Panes[0];

    // Add titles to panes.
    diagram.DefaultPane.Title.Text = "Sales by Region (Units)";
    diagram.DefaultPane.Title.Visibility = DefaultBoolean.True;
    diagram.Panes[0].Title.Text = "Revenue (Millions of USD)";
    diagram.Panes[0].Title.Visibility = DefaultBoolean.True;

    // Customize the pane layout.
    diagram.PaneDistance = 10;
    diagram.PaneLayout.AutoLayoutMode = PaneAutoLayoutMode.Linear;
    diagram.PaneLayout.Direction = PaneLayoutDirection.Horizontal;
    diagram.DefaultPane.LayoutOptions.ColumnSpan = 3;
    diagram.Panes[0].LayoutOptions.ColumnSpan = 2;

    // Add secondary axes to the diagram, and adjust their options.
    diagram.SecondaryAxesX.Add(new SecondaryAxisX("My Axis X"));
    diagram.SecondaryAxesY.Add(new SecondaryAxisY("My Axis Y"));
    diagram.SecondaryAxesX[0].Alignment = AxisAlignment.Near;
    diagram.SecondaryAxesY[0].Alignment = AxisAlignment.Near;
    diagram.SecondaryAxesY[0].GridLines.Visible = true;

    // Assign both the additional pane and, if required,
    // the secondary axes to the second series.
    myView.AxisX = diagram.SecondaryAxesX[0];
    myView.AxisY = diagram.SecondaryAxesY[0];

    // Add the chart to the form.
    chartControl1.Dock = DockStyle.Fill;
    this.Controls.Add(chartControl1);
}