DxChartSeries<T, TArgument, TValue, TAggregate, TModel>.ValueField Property
Specifies a data source field that contains values for series points.
Namespace: DevExpress.Blazor
Assembly: DevExpress.Blazor.v21.1.dll
NuGet Package: DevExpress.Blazor
Declaration
[Parameter]
public Expression<Func<T, TValue>> ValueField { get; set; }
Property Value
| Type | Description |
|---|---|
| Expression<Func<T, TValue>> | The name of the field. |
Remarks
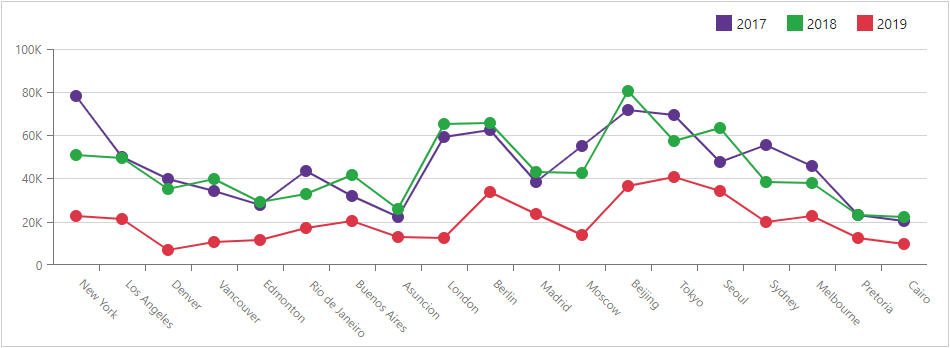
Use the Data property to bind the Chart to an IEnumerable<T> data source. Set the ArgumentField and ValueField properties to data source fields that contain arguments and values for chart points.
<DxChart Data="@ChartsData">
    <DxChartLineSeries Name="2017" Filter="@((SaleInfo s) => s.Date.Year == 2017)"
                       ArgumentField="@(s => s.City)" ValueField="@(s => s.Amount)" />
    <DxChartLineSeries Name="2018" Filter="@((SaleInfo s) => s.Date.Year == 2018)"
                       ArgumentField="@(s => s.City)" ValueField="@(s => s.Amount)" />
    <DxChartLineSeries Name="2019" Filter="@((SaleInfo s) => s.Date.Year == 2019)"
                       ArgumentField="@(s => s.City)" ValueField="@(s => s.Amount)" />
    <DxChartLegend Position="RelativePosition.Outside" HorizontalAlignment="HorizontalAlignment.Right" />
</DxChart>
When you set the ArgumentField or ValueField property to a DateTime data field that contains a time part, extract the date part only. The following code snippet demonstrates how to use the Date field.
<DxChart Data="@WeatherForecasts">
    <DxChartBarSeries Name="Max Temperature, C" AggregationMethod="@((v) => (int)Enumerable.Max(v))"
                      ArgumentField="@(s => s.Date.Date)"
                      ValueField="@((WeatherForecast s) => s.TemperatureC)"/>
</DxChart>
Online Demos
See Also