DxChartAxisGridLines Class
Defines settings for axis grid lines.
Namespace: DevExpress.Blazor
Assembly: DevExpress.Blazor.v21.1.dll
NuGet Package: DevExpress.Blazor
Declaration
public class DxChartAxisGridLines :
    DxSettingsComponent<ChartAxisGridLinesModel>
Remarks
Grid lines are vertical and horizontal lines that stretch throughout the entire Chart component. These grid lines facilitate the readability of chart data.
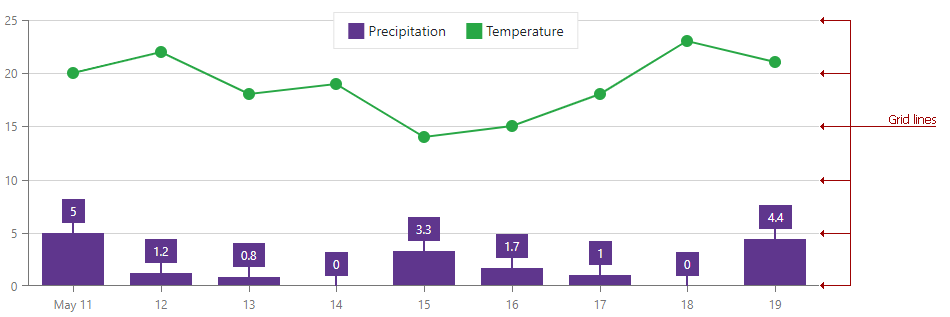
The Chart component’s default grid line visibility is as follows:
- Horizontal (value axis) lines are visible.
- Vertical (argument axis) lines are hidden.
To change the default behavior, use the Visible property.
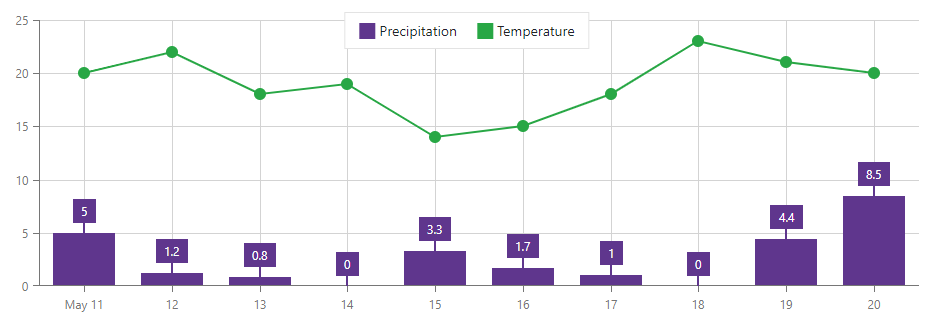
The code below sets the argument axis’s Visible property to true to show vertical grid lines in the Chart component.
<DxChart Data="@forecasts">
    <DxChartBarSeries ArgumentField="@((WeatherForecast i) => i.Date)"
                      ValueField="@((WeatherForecast i) => i.Precipitation)"
                      Name="Precipitation">
        <DxChartSeriesLabel Visible="true">
            <DxChartSeriesLabelConnector Visible="true" Width="2" />
        </DxChartSeriesLabel>
    </DxChartBarSeries>
    <DxChartLineSeries ArgumentField="@((WeatherForecast i) => i.Date)"
                       ValueField="@((WeatherForecast i) => i.TemperatureC)"
                       Name="Temperature">
    </DxChartLineSeries>
    <DxChartArgumentAxis>
        <DxChartAxisGridLines Visible="true" />
    </DxChartArgumentAxis>
</DxChart>
Inheritance
Object
ComponentBase
DxSettingsComponent<DevExpress.Blazor.Internal.ChartAxisGridLinesModel>
DxChartAxisGridLines
See Also