DxChartAxis<TModel>.EndOnTick Property
Specifies whether an axis should start and end on ticks.
Namespace: DevExpress.Blazor
Assembly: DevExpress.Blazor.v21.1.dll
NuGet Package: DevExpress.Blazor
Declaration
[DefaultValue(null)]
[Parameter]
public bool? EndOnTick { get; set; }
Property Value
| Type | Default | Description |
|---|---|---|
| Nullable<Boolean> | *null* | true to start and end the axis on ticks; otherwise, false. |
Remarks
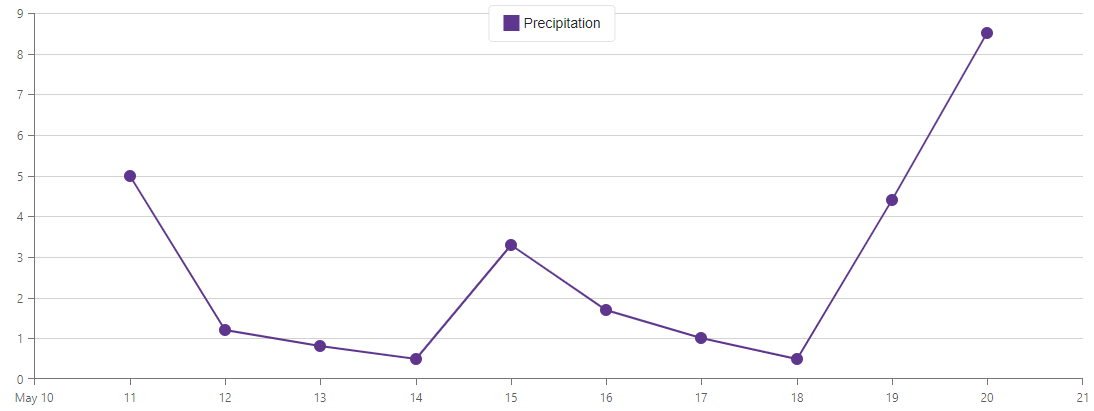
If the EndOnTick property is set to true, the Chart component extends its axes so that they start and end on ticks.
<DxChart Data="@forecasts">
    <DxChartArgumentAxis EndOnTick="true"></DxChartArgumentAxis>
    <DxChartValueAxis EndOnTick="true"></DxChartValueAxis>
    <!-- -->
</DxChart>
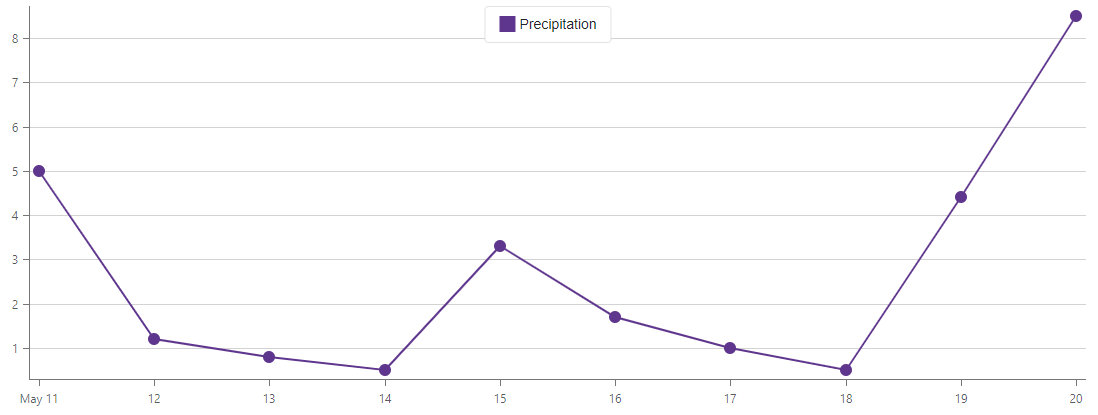
To change the default behavior, set the EndOnTick property to false. In this case, the Chart starts and ends at the outermost points with additional margins.
<DxChart Data="@forecasts">
    <DxChartLineSeries ArgumentField="@((WeatherForecast i) => i.Date)"
                       ValueField="@((WeatherForecast i) => i.Precipitation)"
                       Name="Precipitation">
    </DxChartLineSeries>
    <DxChartArgumentAxis EndOnTick="false" SideMarginsEnabled="true"></DxChartArgumentAxis>
    <DxChartValueAxis EndOnTick="false" SideMarginsEnabled="true"></DxChartValueAxis>

</DxChart>
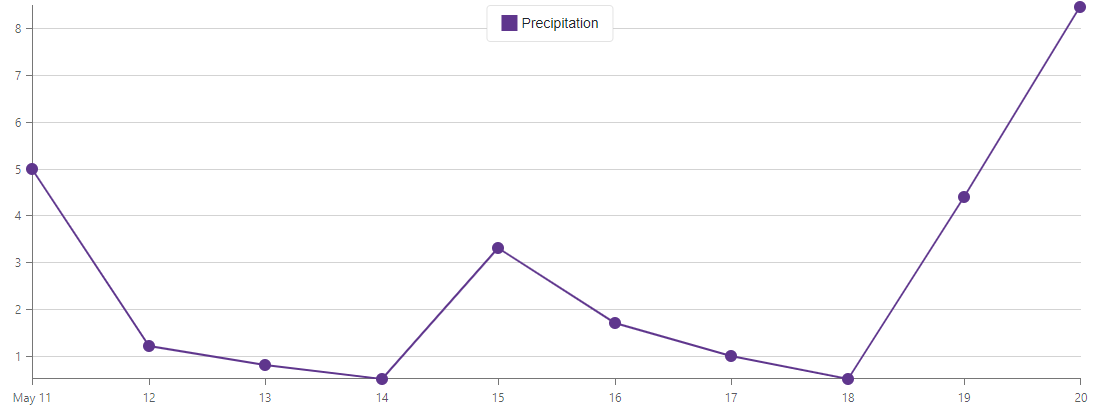
To remove these margins, set SideMarginsEnabled property to false.
<DxChart Data="@forecasts">
    <!--No spaces between the line and the axes-->
    <DxChartArgumentAxis SideMarginsEnabled="false" EndOnTick="false"></DxChartArgumentAxis>
    <DxChartValueAxis Name="Temperature" SideMarginsEnabled="false" EndOnTick="false"></DxChartValueAxis>
    <!-- -->
</DxChart>
See Also