BootstrapChartAxisSettings.VisualRangeSettings Property
Focuses the widget on a specific chart segment.
Namespace: DevExpress.Web.Bootstrap
Assembly: DevExpress.Web.Bootstrap.v26.1.dll
Declaration
[PersistenceMode(PersistenceMode.InnerProperty)]
public VisualRangeSettings VisualRangeSettings { get; }Property Value
| Type | Description |
|---|---|
| DevExpress.Web.Bootstrap.VisualRangeSettings | Specifies the limits of the displayed axis range. |
Remarks
The VisualRangeSettings property sets axis limits to focus the widget on a specific chart segment.
Use one of the following properties to define the visual range of an axis:
StartValue/EndValue PropertyLength PropertyMinLength Property
StartValue and EndValue
Specify the StartValue and EndValue properties:
StartValue - defines the range’s minimum value.
EndValue - defines the range’s maximum value.
A numeric axis:
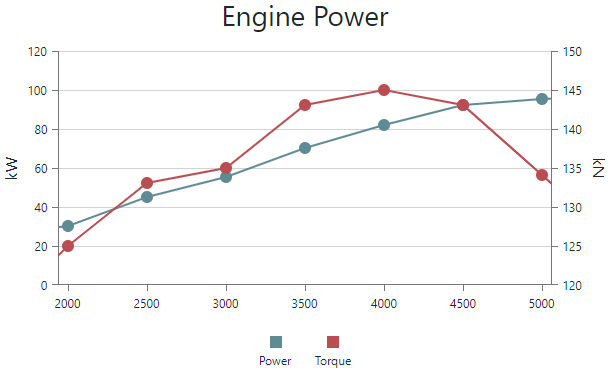
<dx:BootstrapChart ID="Chart" runat="server" ...>
  <!--...-->
  <ArgumentAxis>
      <VisualRangeSettings>
          <NumericAxis StartValue="2000" EndValue="5000" />
      </VisualRangeSettings>
  </ArgumentAxis>
</dx:BootstrapChart>
A string axis:
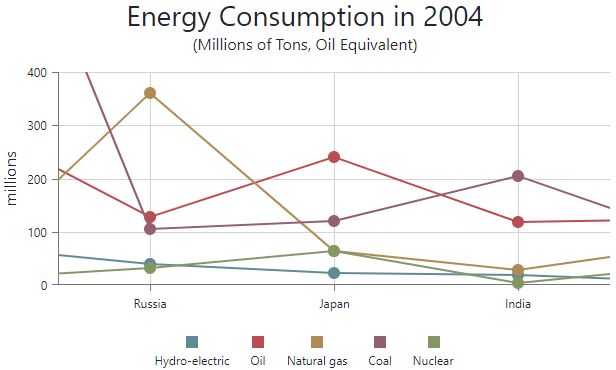
<dx:BootstrapChart ID="Chart" runat="server" ...>
<!--...-->
<ArgumentAxis>
<VisualRangeSettings>
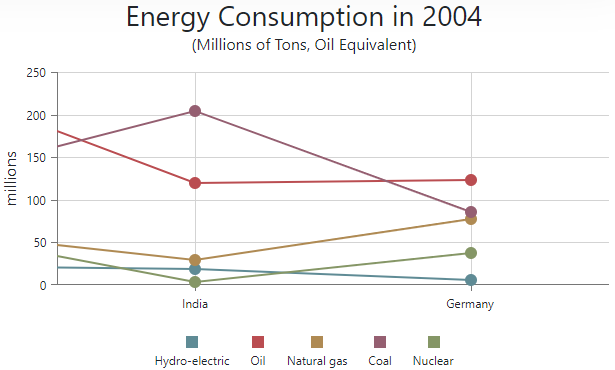
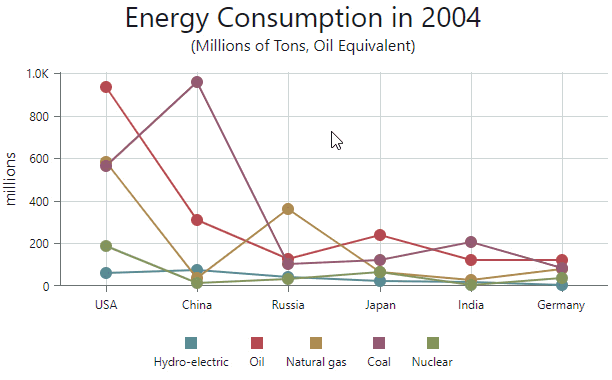
<StringAxis StartValue="Russia" EndValue="India" />
</VisualRangeSettings>
</ArgumentAxis>
</dx:BootstrapChart>
A date axis:
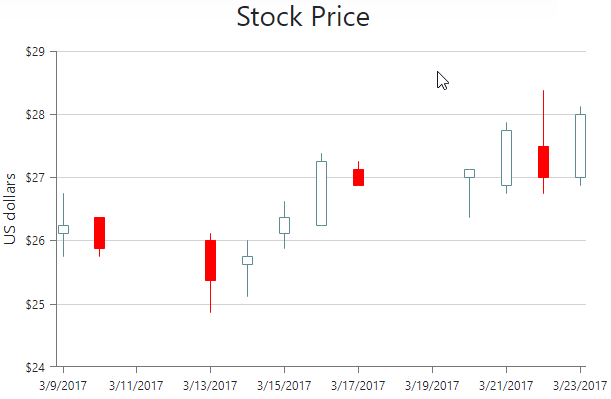
<dx:BootstrapChart ID="Chart" runat="server" ...>
  <!--...-->
  <ArgumentAxis>
      <VisualRangeSettings>
          <DateAxis StartValue="3/9/2017" EndValue="3/23/2017"/>
      </VisualRangeSettings>
  </ArgumentAxis>
</dx:BootstrapChart>
Length
The Length property defines the length of the displayed axis range. The axis ends at the last data value.
A numeric axis:
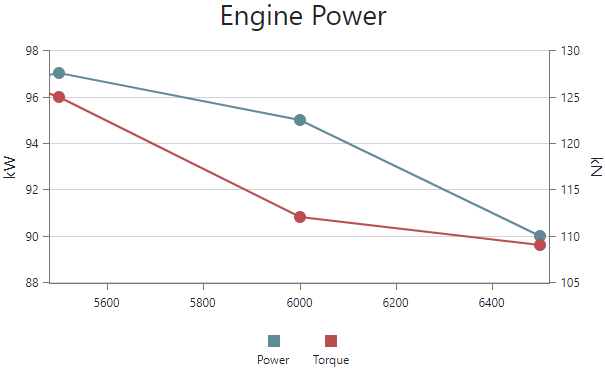
<dx:BootstrapChart ID="Chart" runat="server" ...>
  <!--...-->
  <ArgumentAxis>
      <VisualRangeSettings>
          <NumericAxis Length="1000" />
      </VisualRangeSettings>
  </ArgumentAxis>
</dx:BootstrapChart>
A string axis:
<dx:BootstrapChart ID="Chart" runat="server" ...>
  <!--...-->
  <ArgumentAxis>
      <VisualRangeSettings>
          <StringAxis Length="2" />
      </VisualRangeSettings>
  </ArgumentAxis>
</dx:BootstrapChart>
A date axis:
<dx:BootstrapChart ID="Chart" runat="server" ...>
  <!--...-->
  <ArgumentAxis>
      <VisualRangeSettings>
          <DateAxis Length-Months="3" />
      </VisualRangeSettings>
  </ArgumentAxis>
</dx:BootstrapChart>
MinLength
The MinLength property defines the minimum visual range of the axis when you zoom it.
A numeric axis:
<dx:BootstrapChart ID="Chart" runat="server" ...>
  <!--...-->
  <ArgumentAxis>
      <VisualRangeSettings>
          <NumericAxis MinLength="1000" />
      </VisualRangeSettings>
  </ArgumentAxis>
  <SettingsZoomAndPan AllowMouseWheel="true" ArgumentAxis="Zoom">
</dx:BootstrapChart>
A string axis:
<dx:BootstrapChart ID="Chart" runat="server" ...>
  <!--...-->
  <ArgumentAxis>
      <VisualRangeSettings>
          <StringAxis MinLength="2" />
      </VisualRangeSettings>
  </ArgumentAxis>
  <SettingsZoomAndPan AllowMouseWheel="true" ArgumentAxis="Zoom">
</dx:BootstrapChart>
A date axis:
<dx:BootstrapChart ID="Chart" runat="server" ...>
  <!--...-->
  <ArgumentAxis>
      <VisualRangeSettings>
          <DateAxis MinLength-Months="5"></DateAxis>
      </VisualRangeSettings>
  </ArgumentAxis>
  <SettingsZoomAndPan AllowMouseWheel="true" ArgumentAxis="Zoom">
</dx:BootstrapChart>
You can combine the techniques described above, such as the StartValue and Length properties:
<dx:BootstrapChart ID="Chart" runat="server" ...>
  <!--...-->
  <ArgumentAxis>
      <VisualRangeSettings>
          <NumericAxis StartValue="3200" Length="1300" />
      </VisualRangeSettings>
  </ArgumentAxis>
</dx:BootstrapChart>