BootstrapChart Class
A Chart control.
Namespace: DevExpress.Web.Bootstrap
Assembly: DevExpress.Web.Bootstrap.v26.1.dll
Declaration
[DXClientDocumentationProviderWeb("BootstrapChart")]
[ToolboxBitmap(typeof(BootstrapToolboxBitmapAccess), "Bitmaps256.BootstrapChart.bmp")]
[ToolboxTabName("DX.26.1: Bootstrap Controls")]
public class BootstrapChart :
BootstrapCoordinateSystemChartRelated API Members
The following members return BootstrapChart objects:
Remarks
The DevExpress ASP.NET Bootstrap Charts suite is a set of server-side wrappers for DevExtreme chart widgets allowing you to use ASP.NET approaches to integrating DevExtreme Charts into your web application.
The Bootstrap Chart control visualizes data from a local or remote storage in a 2d coordinate system along with different interactive elements, such as tooltips, crosshair pointer, legend, etc.
To create a Bootstrap Chart control from your code, use the following API:
- BootstrapWebClientUIWidget.DataSource - binds a chart to the required date source.
- BootstrapChart.SeriesCollection - adds required series to a chart’s series collection.
- BootstrapChart.ArgumentAxis, BootstrapChart.ValueAxisCollection - sets up chart axes.
- BootstrapChartBase.SettingsLegend - provides options for setting up a chart legend.
Example
This example demonstrates the basic functionality of the Chart control.
- Initilize a new instance of the
BootstrapChartclass. - Bind the chart control to the required data storage. For this purpose, assign the URL of your data storage (in this demo, a JSON file) to the BootstrapWebClientUIWidget.DataSourceUrl property.
- Define chart axes. For this purpose, use the BootstrapChartArgumentAxis and BootstrapChartValueAxis classes.
- Add required series to the BootstrapChart.SeriesCollection array.
- Use other available
BootstrapChartclass properties to customize the chart. For instance, you can swap chart axes by setting the BootstrapChart.Rotated property to true.
The image below shows the result:
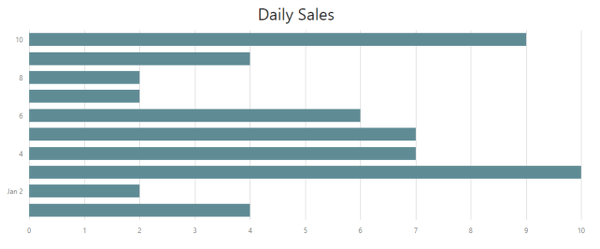
<dx:BootstrapChart runat="server" DataSourceUrl="~/jsondata/simple.json" TitleText="Daily Sales" Rotated="true">
    <ArgumentAxis ArgumentType="System.DateTime" MaxValue="2017-01-10" />
    <ValueAxisCollection>
        <dx:BootstrapChartValueAxis TickInterval="1" />
    </ValueAxisCollection>
    <SeriesCollection>
        <dx:BootstrapChartBarSeries ArgumentField="date" ValueField="sales" />
    </SeriesCollection>
    <SettingsLegend Visible="false" />
</dx:BootstrapChart>
Inheritance
See Also