How to: Bind a Chart to Data Using Series Templates
- 5 minutes to read
This tutorial demonstrates how to create a chart bound to data, so that all series are auto-created based on a common template, which specifies universal options for all series. This is possible when the data for all series (their names, along with points’ arguments and values) are stored in the same data source.
Note that in this scenario, the view type and certain other settings, will be the same for all series.
In this example, we’ll bind a chart to the “GSP” table in the Gsp database (the gsp.mdb file shipped with the installation of the XtraCharts Suite). This table contains the Gross State Product (GSP) statistics for certain US regions.
To bind a chart to data using series templates, do the following.
- Create Data Objects and Bind a ChartControl
- Specify a Series Data Member and Adjusting a Series Template
- Populate with Data at Runtime (Optional)
- Customize the Chart
- Get the Result
Create Data Objects and Bind a ChartControl
- Start Microsoft Visual Studio and create a new Windows Forms Application or open an existing one.
Drop the ChartControl onto the form.
To dock the ChartControl in its container form, you can set its Dock property to Fill.
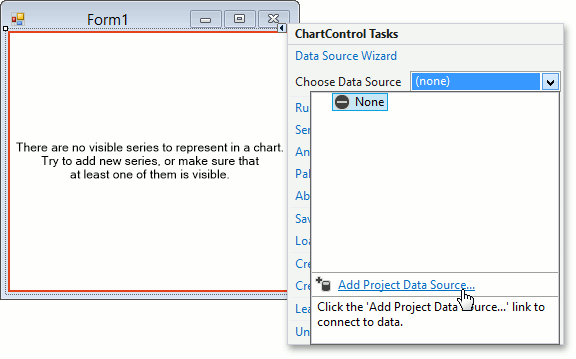
To create a data source for a chart, select it and click its smart tag. In the invoked actions list, expand the Data Source drop-down selector, and click the Add Project Data Source… link.
Then, proceed through the following steps suggested by the invoked Data Source Configuration Wizard.
In the first step, choose the Database icon and click Next.

Then, specify the GSP database. If it doesn’t appear in the drop-down list, click the New Connection… button, and specify the path to the MDB file.

Click Next to proceed.
On the following page, you are asked whether or not the created connection string should be saved to the configuration file of your project.

Leave the default setting and click Next.
The final page allows you to choose tables, which should be obtained from the database.

Select the “GSP” table and click Finish.
After performing the above steps, Visual Studio generates a set of classes that support ADO.NET architecture, some of which are then auto-assigned to appropriate properties of your chart control. In particular:
gspDataSet (a DataSet object that is a collection of possibly inter-related tables) containing the gspDataTable;
gSPBindingSource (a BindingSource component, which provides data in the chart’s dataset) is auto-assigned to the ChartControl.DataSource property;
gSPTableAdapter - a TableAdapter object, which contains methods to get and post data from the specified table in the database.
This means that the chart has been successfully bound to the data source. The next steps explain how to assign its data fields to the chart’s series template.
Specify a Series Data Member and Adjusting a Series Template
Now, let’s specify a data field, for as many series to be auto-created as there are records in this field. This is defined via the ChartControl.SeriesDataMember property, which is set to Year in this example.

Note that series names (as they will appear in the Legend) will correspond to this field’s values.
Now, adjust a series template which is accessed via the chart’s ChartControl.SeriesTemplate property.
In particular, it is required to define the data fields where series obtain information for their point arguments and values.
So, set the SeriesBase.ArgumentDataMember property to Region, …

… and the only value in the SeriesBase.ValueDataMembers collection to GSP.

Note that some series view types may require more than one value for each argument (such as Stock or Bubble series). In such cases, multiple data members should be specified for the SeriesBase.ValueDataMembers collection.
Now, the chart possesses complete information about the data source and its data members. However, it still doesn’t show the real data at design time. To populate your chart with genuine data, click the chart’s smart tag and click Populate.
Populate with Data at Runtime (Optional)
Note that Microsoft Visual Studio automatically adds the following code to the form’s Load event, and normally you don’t need to add it manually.
To populate a DataTable object with data from the database, the corresponding TableAdapter‘s Fill method can be used. In this example, the chart’s DataTable is populated with data using the Fill method of the gSPTableAdapter object. The form’s Load event is used to handle data loading.
Customize the Chart
Finally, you can specify optional properties, which will be applied to all the auto-created series.
Adjust the Series Name Template
By default, the name for every auto-created series (as it appears in the Legend) is obtained from an appropriate data field. However, you may wish to add some prefixes or postfixes to these names, which can be done via the SeriesNameTemplate.BeginText and SeriesNameTemplate.EndText properties.
Or when it is required to completely substitute the auto-defined names with custom ones, this can be done in the ChartControl.CustomDrawSeries event, by specifying the CustomDrawSeriesEventArgsBase.LegendText property. For a code example, refer to How to: Change the Names for Auto-Created Series.
Other Tasks
To specify a color for series points, use the ChartControl.PaletteBaseColorNumber, ChartControl.PaletteName and ChartControl.AppearanceName properties. For more information on their use, refer to Appearance Customization.
Get the Result
Run the project and view the result.
