Timescale
- 4 minutes to read
The chart area displays a timescale. The GanttControl.ChartStartDate and GanttControl.ChartFinishDate properties specify the start and finish dates on the timescale.
Zoom
The timescale ruler can be in hours, days, weeks, etc. Users can hold Ctrl and use the mouse wheel to change the measure unit.
The GanttControl.ZoomMode property specifies how the scale changes:
- first decreases the size of a single division to a certain limit and then switches to the next measure unit (week, month, quarter, etc.).
- switches to the next measure unit by each wheel step.
You can call the GanttControl.ZoomIn and GanttControl.ZoomOut methods to change the measure unit in code.
Rulers
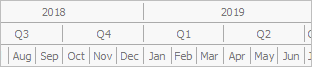
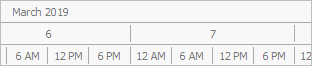
The timescale can show from one to three rulers. Rulers display different measure units depending on the zoom factor: years-quarters-months, months-days-hours, etc.
The GanttControl.TimescaleRulerCount property specifies the number of rulers in the timescale.
Measure Units
The GanttControl.OptionsMainTimeRuler provides access to the bottom timescale ruler’s following options:
Unit - specifies the time interval that corresponds to a single measure unit on the time scale. For example, the time scale can be in hours, days, or months.


Count - specifies the number of measure units in a single division. For example, if the measure unit is an hour, a single division can correspond to one, two, or six hours.


MinUnit and MaxUnit - specify the minimum and maximum measure unit.
Customize Timescale Rulers
The GanttControl.RequestTimescaleRulers event allows you to customize the timescale rulers.
The code below shows how to change the date-time format depending on the time scale ruler’s measure unit.
using DevExpress.XtraGantt;

private void ganttControl1_RequestTimescaleRulers(object sender, DevExpress.XtraGantt.RequestTimescaleRulersEventArgs e) {
    GanttTimescaleRuler ruler0 = e.TimescaleRulers[0];
    if (ruler0.Unit == GanttTimescaleUnit.Month)
        ruler0.DisplayFormat = "MMM yy";
    GanttTimescaleRuler ruler1 = e.TimescaleRulers[1];
    if (ruler1.Unit == GanttTimescaleUnit.Day)
        ruler1.DisplayFormat = "dddd, d";
}
Columns
The GanttControl.CustomDrawTimescaleColumn event fires before a column in the chart area is displayed. This event allows you to draw the column manually.
The code below shows how to display a deadline.

DateTime deadLine = TaskStorage.GetFinishDateFromTask("Deploy Beta");
ganttControl.CustomDrawTimescaleColumn += (sender, e) => {
    GanttTimescaleColumn column = e.Column;
    if(column.StartDate <= deadLine && column.FinishDate >= deadLine) {
        e.DrawBackground();
        float x = (float)e.GetPosition(deadLine); float width = 4;
        RectangleF deadLineRect = new RectangleF(x, column.Bounds.Y, width, column.Bounds.Height);
        e.Cache.FillRectangle(DXSkinColors.FillColors.Danger, deadLineRect);
        e.DrawHeader();
        e.Handled = true;
    }
};
The code below shows how to draw striplines.

DateTime striplineStart = DateTime.Now.AddHours(5);
DateTime striplineEnd = striplineStart.AddHours(4);
Color striplineColor = Color.FromArgb(128, 255, 224, 166);
ganttControl.CustomDrawTimescaleColumn += (sender, e) => {
    GanttTimescaleColumn column = e.Column;
    float stripLineStartPoint = (float)Math.Max(e.GetPosition(striplineStart), column.Bounds.Left);
    float stripLineEndPoint = (float)Math.Min(e.GetPosition(striplineEnd), column.Bounds.Right);
    e.DrawBackground();
    RectangleF boundsToDraw = new RectangleF(stripLineStartPoint, column.Bounds.Y, stripLineEndPoint - stripLineStartPoint, column.Bounds.Height);
    if(boundsToDraw.Width > 0)
        e.Cache.FillRectangle(striplineColor, boundsToDraw);
    e.DrawHeader();
    e.Handled = true;
};