Spline Chart
- 3 minutes to read
Short Description
The Spline Chart is represented by the Spline3DSeriesView object, which belongs to Line Series Views. This view is similar to Line Chart, but plots a fitted curve through each data point in a series.
A Spline chart is shown in the image below.
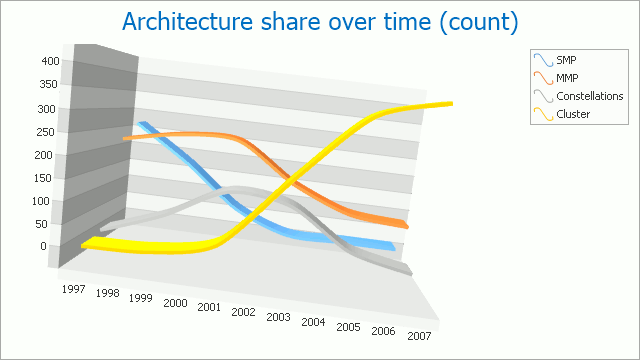
Chart Type Characteristics
The table below lists the main characteristics of this chart type.
| Feature | Value |
|---|---|
| Series View type | Spline3DSeriesView |
| Diagram type | XYDiagram3D |
| Number of arguments per series point | 1 |
| Number of values per series point | 1 |
Note
For information on which chart types can be combined with the Spline Chart, refer to the Series Views Compatibility document.
Example
The following example demonstrates how to create a ChartControl with a series of the Spline3DSeriesView type, set its general properties, and add this chart to a form at runtime. Before proceeding with this example, first create a Windows Forms Application in Visual Studio, and include all necessary assemblies to the References list of your project.
Then, add the following code to the Form.Load event handler.
using System;
using System.Windows.Forms;
using DevExpress.XtraCharts;
// ...

private void Form1_Load(object sender, EventArgs e) {
    // Create a new chart.
    ChartControl SplineChart3D = new ChartControl();

    // Add a spline series to it.
    Series series1 = new Series("Series 1", ViewType.Spline3D);

    // Add points to the series.
    series1.Points.Add(new SeriesPoint("A", 12));
    series1.Points.Add(new SeriesPoint("B", 4));
    series1.Points.Add(new SeriesPoint("C", 17));
    series1.Points.Add(new SeriesPoint("D", 7));
    series1.Points.Add(new SeriesPoint("E", 12));
    series1.Points.Add(new SeriesPoint("F", 4));
    series1.Points.Add(new SeriesPoint("G", 17));
    series1.Points.Add(new SeriesPoint("H", 7));

    // Add both series to the chart.
    SplineChart3D.Series.Add(series1);

    // Access labels of the series.
    ((Line3DSeriesLabel)series1.Label).Visible = true;
    ((Line3DSeriesLabel)series1.Label).ResolveOverlappingMode =
        ResolveOverlappingMode.Default;

    // Access another series options.
    series1.Label.PointOptions.PointView = PointView.ArgumentAndValues;

    // Customize the view-type-specific properties of the series.
    Spline3DSeriesView myView = (Spline3DSeriesView)series1.View;
    myView.LineWidth = 5;
    myView.LineThickness = 4;
    myView.LineTensionPercent = 50;

    // Access the diagram's options.
    ((XYDiagram3D)SplineChart3D.Diagram).ZoomPercent = 110;
    ((XYDiagram3D)SplineChart3D.Diagram).VerticalScrollPercent = 10;

    // Add a title to the chart and hide the legend.
    ChartTitle chartTitle1 = new ChartTitle();
    chartTitle1.Text = "3D Spline Chart";
    SplineChart3D.Titles.Add(chartTitle1);
    SplineChart3D.Legend.Visible = false;

    // Add the chart to the form.
    SplineChart3D.Dock = DockStyle.Fill;
    this.Controls.Add(SplineChart3D);
}