Full-Stacked Line Chart
Short Description
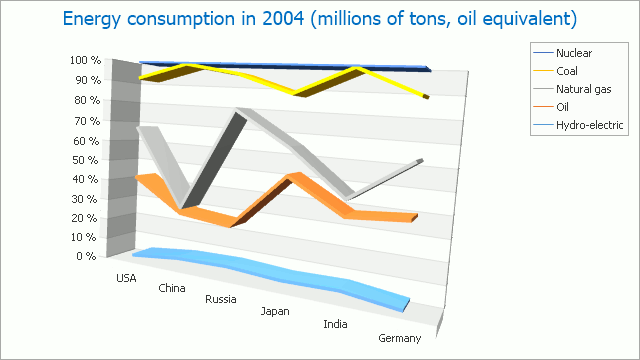
The Full-Stacked Line chart (100%-Stacked Line Chart) is represented by the FullStackedLine3DSeriesView object, which belongs to Line Series Views. This view displays all series stacked and is useful when it is necessary to compare how much each series adds to the total aggregate value for specific arguments (as percents).
A Full-Stacked Line chart is shown in the image below.
Note
A Full-Stacked Line chart can display series containing data points with positive or negative values. However, a series with positive values is stacked only with other series containing positive values; and a series with negative values is stacked with other series containing negative values.
Note that if a series contains data points with both positive and negative values, it is treated as a series with positive values, while all its negative values are treated as zeros.
Chart Type Characteristics
The table below lists the main characteristics of this chart type.
| Feature | Value |
|---|---|
| Series View type | FullStackedLine3DSeriesView |
| Diagram type | XYDiagram3D |
| Number of arguments per series point | 1 |
| Number of values per series point | 1 |
Note
For information on which chart types can be combined with the Full-Stacked Line Chart, refer to the Series Views Compatibility document.