Data Field
- 2 minutes to read
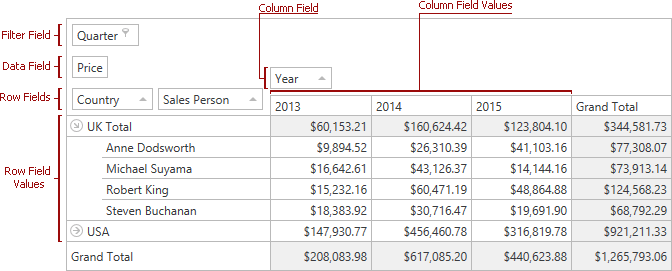
Data fields represent fields located in a pivot grid’s Data Header Area. The Pivot Grid calculates summaries against data fields. Summary results are displayed within the Data Area.
For numeric data fields, the PivotGrid can calculate Sum, Min, Max, Average, Median, and other summary functions. For a complete list of the predefined summary functions and their descriptions, see the FieldSummaryType enumeration.
Data fields that contain non-numeric values can use only the Count, Min, and Max functions. Otherwise, the corresponding data cells display zeros.
The following image shows the DXPivotGrid control that contains one data field - Sales.
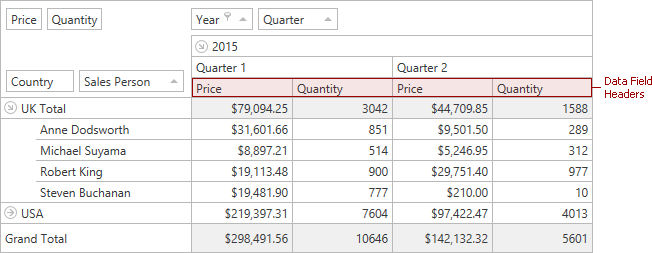
When there are two or more data fields, DXPivotGrid displays data field headers to distinguish between different summary values.
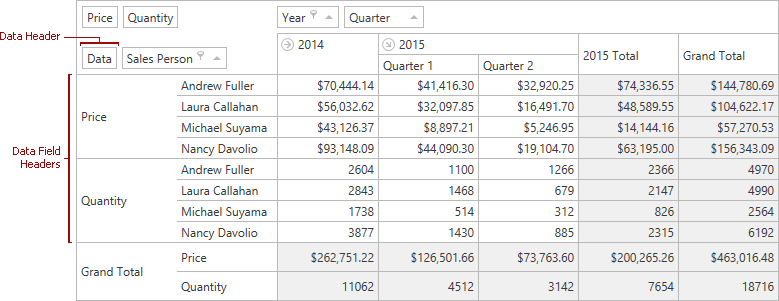
By default, data field headers are listed along the top of the control. It is possible to display data field headers along the left side of the control by setting the PivotGridControl.DataFieldArea property to DataFieldArea.RowArea. The PivotGridControl.DataFieldAreaIndex property specifies the position of the data field headers within the hierarchy of field values.
Setting the PivotGridControl.DataFieldArea property to DataFieldArea.ColumnArea or DataFieldArea.RowArea enables the data header that is linked with data field headers. You can drag the data field headers to a specific position within a column header’s or row header’s areas.
The following table lists the main properties affecting the element’s appearance.
Field Name and Caption | |
Bound Type | |
Summary Type | |
Visibility | |
Position |
Tip
The PivotGridControl.FieldPropertyChanged event is raised after a field’s property has been changed.