Lesson 1 - Load Image Tiles to a Map
- 4 minutes to read
This step-by-step tutorial describes how to connect a map to the Azure Maps imagery service and load image tiles. It also shows how to configure main map settings like the center point and zoom level.

Step 1. Add a Map Control
Run Microsoft Visual Studio (VS 2022 is used in this tutorial).
Create a new WPF Application project.
Add the MapControl component to your project.
To do this, locate the MapControl item in the Visual Studio Toolbox on the DX.26.1: Data & Analytics tab and drop it onto the main window.

This action adds the DevExpress.Wpf.Map NuGet package if you add the MapControl to a .NET Core Application.
If you add the MapControl to a .NET Framework application, the following libraries are added:
- DevExpress.Xpf.Map.v26.1
- DevExpress.Map.v26.1.Core
- DevExpress.Data.v26.1
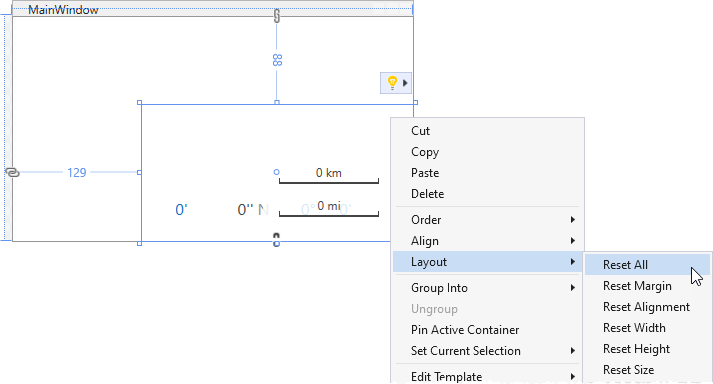
Right-click the MapControl object and choose the Layout | Reset All option in the context menu. This stretches the Map control to fill the whole window.
Specify the MapControl.CenterPoint property to focus the map on a specified point. For example, set the
CenterPointproperty to45, 18to show Europe in the center of the map.To specify the current zoom level for all map layers, use the MapControl.ZoomLevel property (for example, set its value to
4).
After this the markup looks as follows:
<Window ...
        xmlns:dxm="http://schemas.devexpress.com/winfx/2008/xaml/map">
    <Grid>
        <dxm:MapControl CenterPoint="45,18" ZoomLevel="4"/>
    </Grid>
</Window>
If you wish to add a map at runtime, refer to the following page: How to: Add a Map Control at Runtime.
Step 2. Connect to an Imagery Service
The Map Control can load raster and vector tiles from different sources. To show tiles, the Map Control uses image layers. Follow the steps below to display image tiles from Azure Maps service:
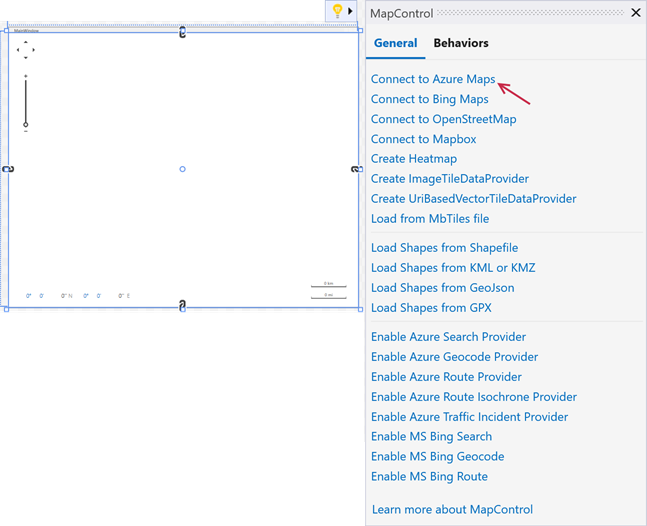
Invoke the Map Control’s smart tag menu or Quick Actions and select the Connect to Azure Maps action.
This action adds an ImageLayer to the MapControl.Layers collection and assigns an AzureMapDataProvider to the ImageLayer.DataProvider property.
The resulting markup looks as follows:
<dxm:MapControl CenterPoint="45,18" ZoomLevel="4">
    <dxm:ImageLayer>
        <dxm:AzureMapDataProvider Tileset="Imagery" AzureKey="INSERT_AZURE_MAPS_KEY"/>
    </dxm:ImageLayer>
</dxm:MapControl>
Note: Since the
LayersandDataProviderproperties are XAML content properties, you can omit the corresponding<Layers>and<DataProvider>tags in the markup.Specify the AzureMapDataProvider.AzureKey property to use Azure Maps services.
Define the AzureMapDataProvider.Tileset property to change the tileset that the provider loads from the service.
<dxm:AzureMapDataProvider Tileset="BaseRoad" .../>
Step 3. Add a Mini Map
Add a mini map to show an additional miniature map with a smaller zoom level at the top-right corner of the map. To add the mini map, follow the steps below:
Initialize the MapControl.MiniMap property with a MiniMap object.
Similar to regular image layers, you can load tiles from different sources to the mini map. To do this, add a MiniMapImageTilesLayer to the MiniMap.Layers collection. Then, set the mini map’s DataProvider property to an AzureMapDataProvider object. Define the
AzureMapDataProvider‘sAzureKeyandTilesetas you did in the Step 2.Note: Since the
LayersandDataProviderproperties are XAML content properties, you can omit the corresponding<Layers>and<DataProvider>tags in the markup.The Map Control supports different modes that specify how the mini map behaves when you navigate within it. This tutorial shows how to enable Fixed behavior. In this mode, the mini map’s zoom level and a center point are fixed.
Set the MiniMap.Alignment property to
TopRightto specify the mini map’s position.
<dxm:MapControl.MiniMap>
    <dxm:MiniMap Alignment="TopRight">
        <dxm:MiniMap.Behavior>
            <dxm:FixedMiniMapBehavior CenterPoint="45, 18" ZoomLevel="1"/>
        </dxm:MiniMap.Behavior>
        <dxm:MiniMapImageTilesLayer>
            <dxm:AzureMapDataProvider Tileset="BaseRoad"
                                      AzureKey="INSERT_AZURE_MAPS_KEY" />
        </dxm:MiniMapImageTilesLayer>
    </dxm:MiniMap>
</dxm:MapControl.MiniMap>
Results
The code snippet below shows the resulting map:
<Window
        xmlns="http://schemas.microsoft.com/winfx/2006/xaml/presentation"
        xmlns:x="http://schemas.microsoft.com/winfx/2006/xaml"
        xmlns:d="http://schemas.microsoft.com/expression/blend/2008"
        xmlns:mc="http://schemas.openxmlformats.org/markup-compatibility/2006"
        xmlns:local="clr-namespace:GettingStartedLesson1"
        xmlns:dxm="http://schemas.devexpress.com/winfx/2008/xaml/map"
        x:Class="GettingStartedLesson1.MainWindow"
        mc:Ignorable="d"
        Title="MainWindow" Height="360" Width="640">
    <Grid>
        <dxm:MapControl CenterPoint="45,18" ZoomLevel="4">
            <dxm:ImageLayer>
                <dxm:AzureMapDataProvider Tileset="BaseRoad"
                                          AzureKey="INSERT_AZURE_MAPS_KEY"/>
            </dxm:ImageLayer>
            <dxm:MapControl.MiniMap>
                <dxm:MiniMap Alignment="TopRight">
                    <dxm:MiniMap.Behavior>
                        <dxm:FixedMiniMapBehavior CenterPoint="45, 18" ZoomLevel="1"/>
                    </dxm:MiniMap.Behavior>
                    <dxm:MiniMapImageTilesLayer>
                        <dxm:AzureMapDataProvider Tileset="BaseRoad"
                                                  AzureKey="INSERT_AZURE_MAPS_KEY" />
                    </dxm:MiniMapImageTilesLayer>
                </dxm:MiniMap>
            </dxm:MapControl.MiniMap>
        </dxm:MapControl>
    </Grid>
</Window>
Run the application to see the resulting map:
Next Steps
- Lesson 2 - Load a Vector Cartesian Map
- This tutorial explains how to show vector shapes in the Cartesian coordinate system.
- GIS Data
- This topic lists GIS services that allow you to receive information related to map locations.
- Generate Vector Items Automatically
- This topic explains how to show map vector shapes over the map. For example, you can use this approach to show map pushpins over the geographical map created in this tutorial.