Bind a Dashboard to a Parameterized Stored Database Procedure
- 9 minutes to read
This tutorial creates a Delphi or C++Builder application that obtains data for an ExpressDashboard from a stored database procedure and uses a dashboard parameter as a procedure parameter. The tutorial uses DevExpress Dashboard Designer and Dashboard Wizard design-time dialogs.
- Sample SQL Server Database
- Step 1 — Create and Configure a RAD Studio Project
- Step 2 — Bind the Stored Procedure as a Dashboard Data Source
- Step 3 — Add a Choropleth Map Item and Bind It to Data
- Step 4 — Create and Pass Dashboard Parameters to the Stored Procedure
- Step 5 — Modify Parameter Values and Review the Dashboard
- Next Steps
- Other Tutorials
Sample SQL Server Database
This tutorial requires a configured relational database with a parameterized stored procedure. The scenario is based on the Microsoft SQL Server with the Northwind sample database. To follow this tutorial, download the Northwind database or use an existing database in your development environment.
Step 1 — Create and Configure a RAD Studio Project
Place DevExpress Components on a Form
Create a new Delphi or C++Builder project and place the following DevExpress components on a form:
- TdxDashboardControl
- A VCL Dashboard control designed to display and autoarrange data analysis elements, such as grids, charts, maps, gauges, etc.
- TdxBackendDataConnectionManager
- Manages data sources for all dashboards in your application.
Configure a Database (SQL) Connection
- Right-click the TdxBackendDataConnectionManager on the form and select Edit to open the Collection Editor dialog.
- Click the Add (plus) button and select Database (SQL) in the drop-down list. A new connection (TdxBackendDatabaseSQLConnection) is added to the connection manager. Close the Edit dialog.
- Select the newly created connection in the Object Inspector. Set the connection’s DisplayName. Dashboard Designer uses this name to display the connection in the UI.
Paste the following string into the ConnectionString property:
XpoProvider=MSSqlServer;Data Source=(local);Initial Catalog=Northwind;Integrated Security=True;TrustServerCertificate=True;Persist Security Info=False;Encrypt=True;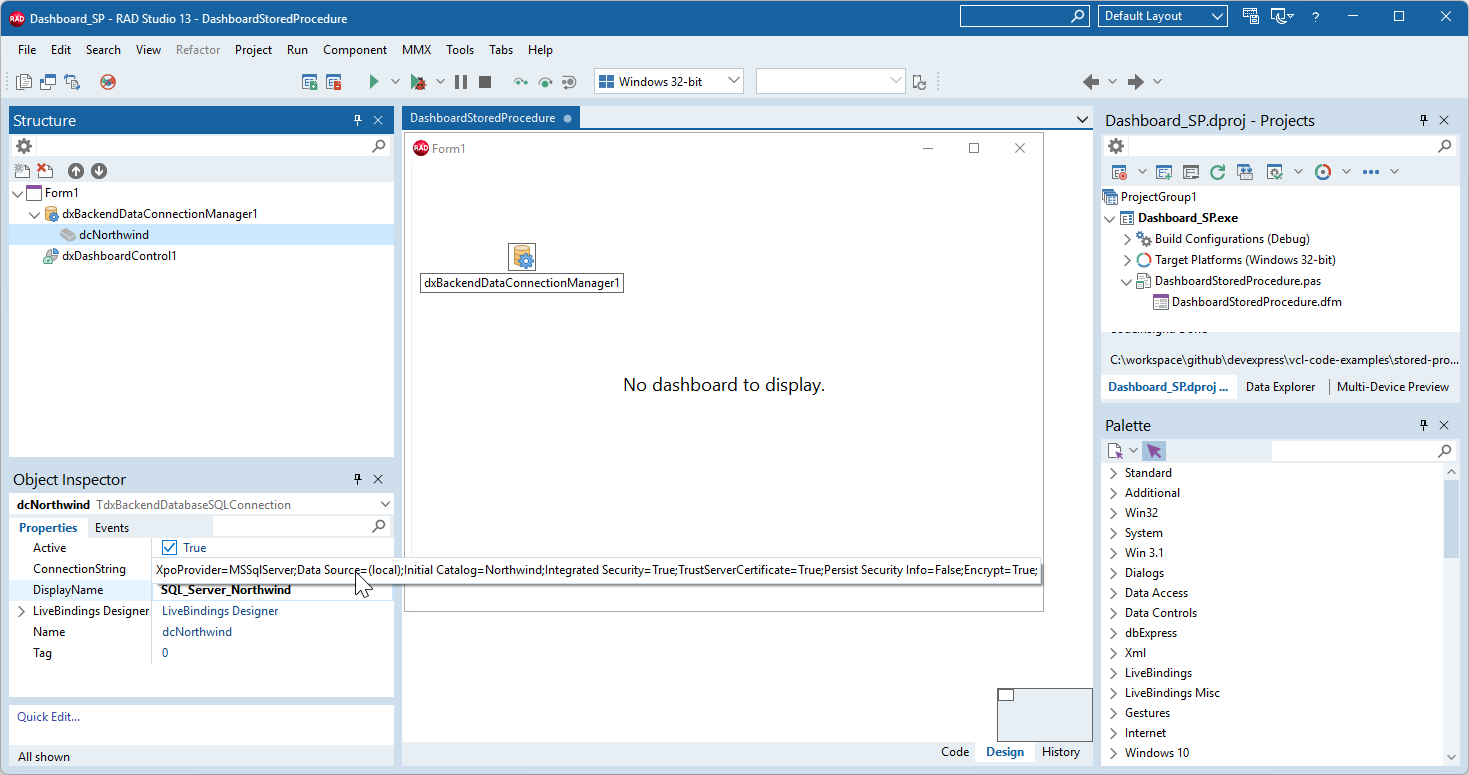
Tip
For additional information on using the SQL Server with ExpressDashboards, refer to the following guide:
Step 2 — Bind the Stored Procedure as a Dashboard Data Source
Create and Configure a Dashboard Data Source
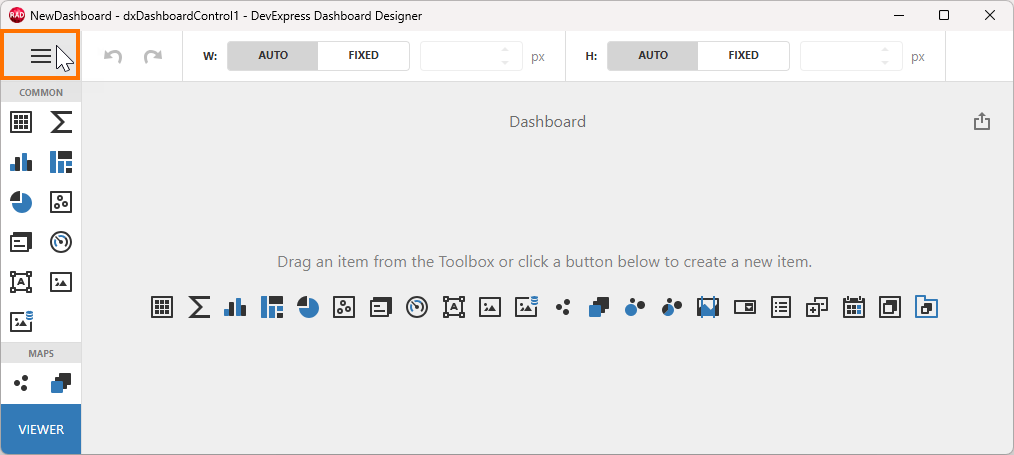
Right-click the TdxDashboardControl component and select the Designer… option[1] to display the Dashboard Designer dialog. Click the hamburger button to display the Dashboard Designer menu.
Select Data Sources to display the corresponding pane. Click Add to display the Add Data Source dialog.
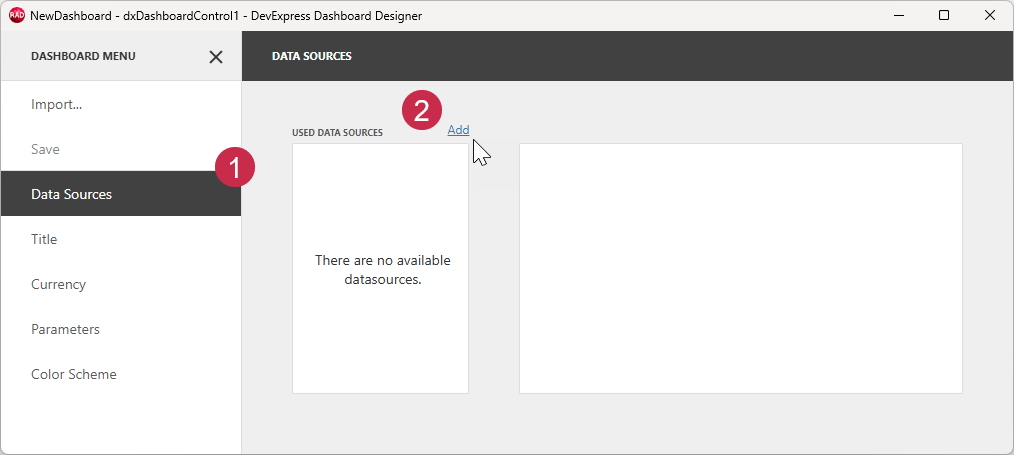
Click Create data source… in the Add Data Source dialog to display the Data Source Wizard.
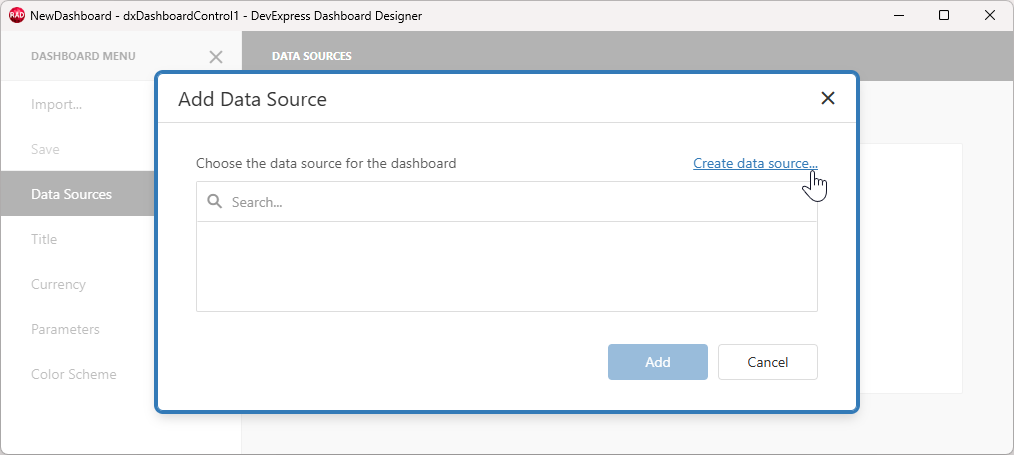
Select Database as the data source and click Next:
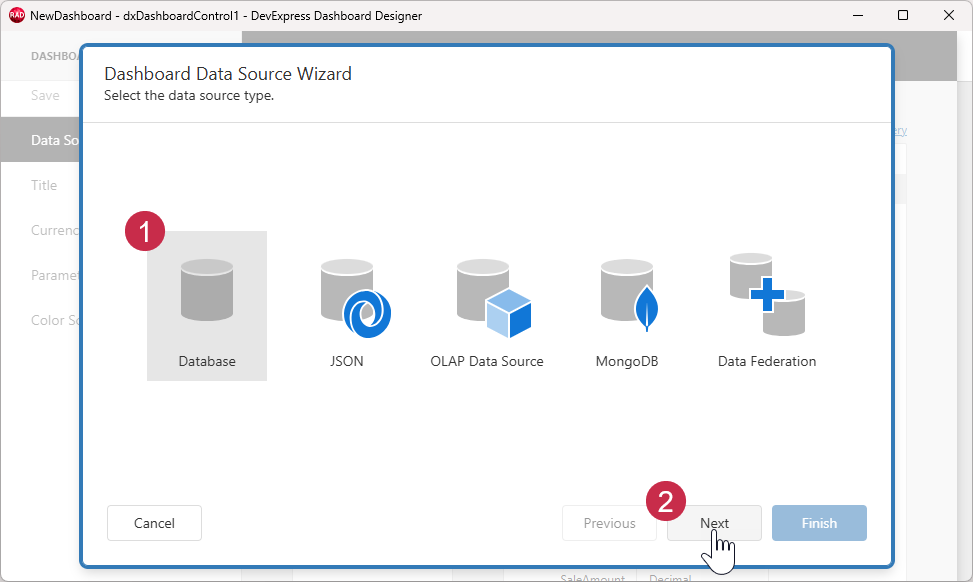
Select the previously configured data connection and click Next:
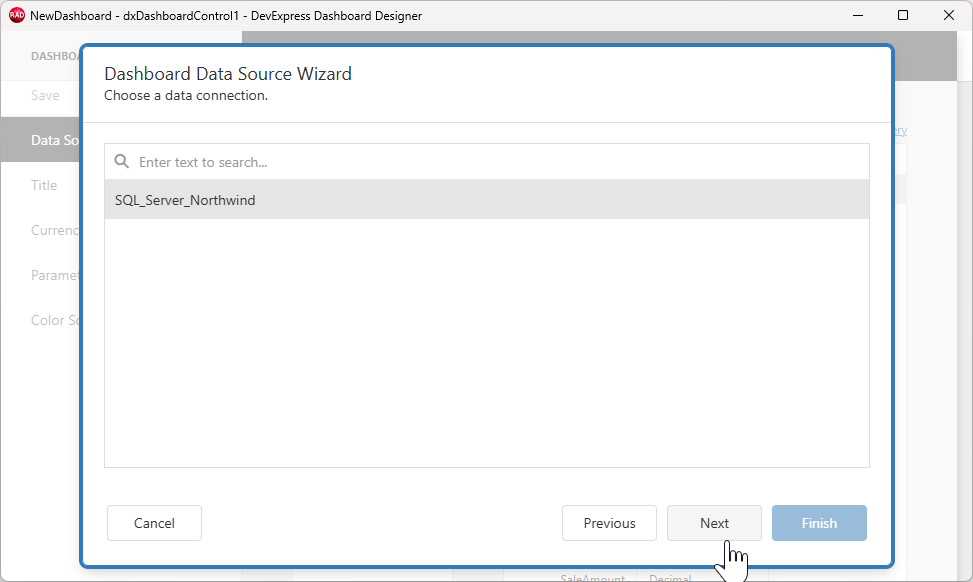
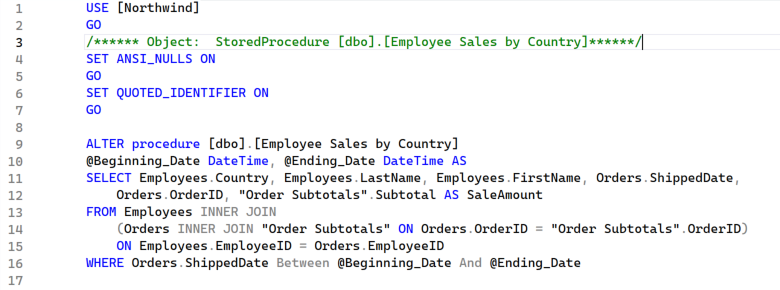
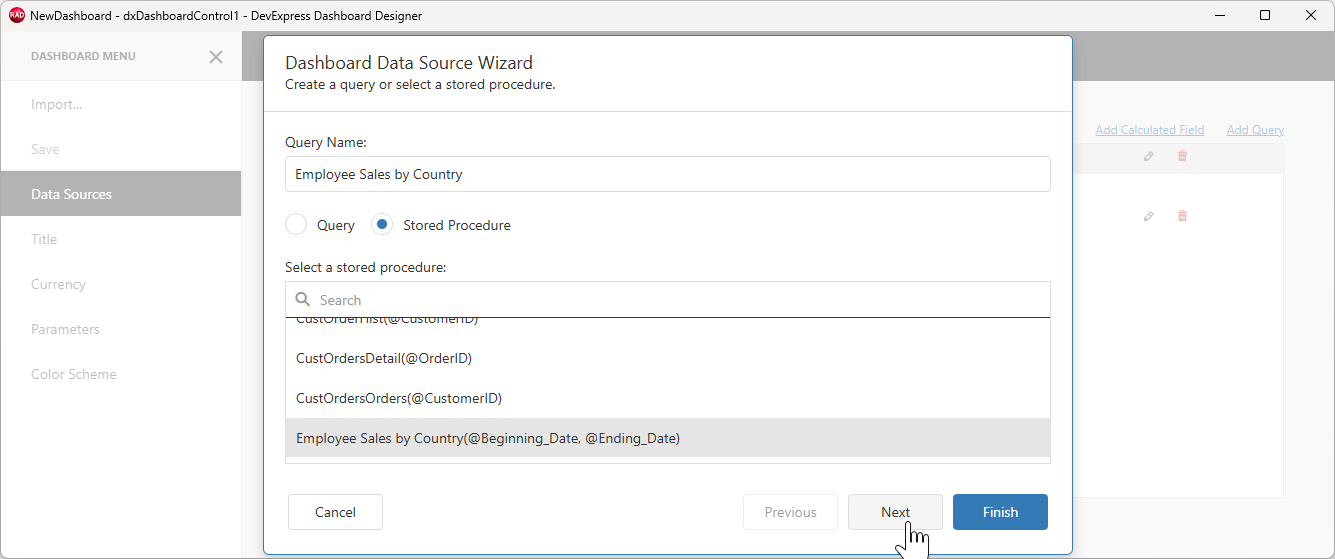
Switch to Stored Procedure, select the Employee Sales by Country procedure, and click Next to proceed to the Query Parameters dialog:
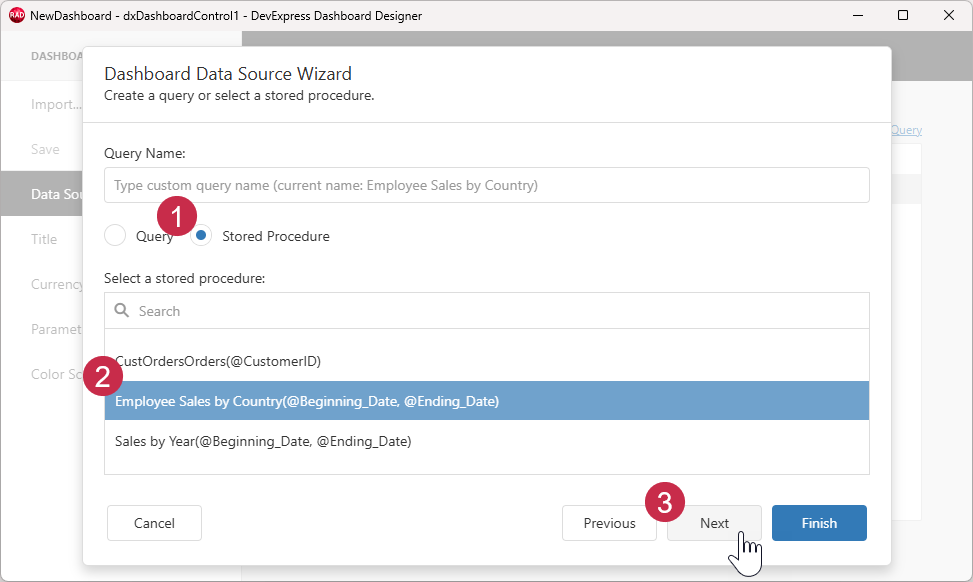
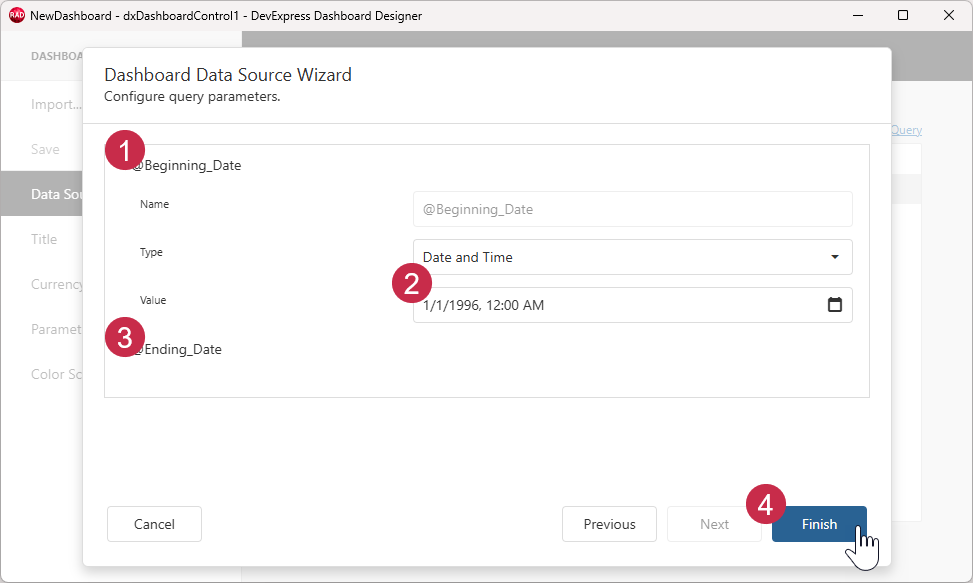
Specify data source parameter settings:
- Expand the
@Beginning_Dateparameter. - Enter
1/1/1996in the parameter’s Value field. - Expand the
@Ending_Dateparameter and enter1/1/1999in the Value field. (You will replace both parameter values with expressions using dashboard parameters later in this tutorial.) - Click Finish to save the configured dashboard data source.
Select and Review the Configured Data Source
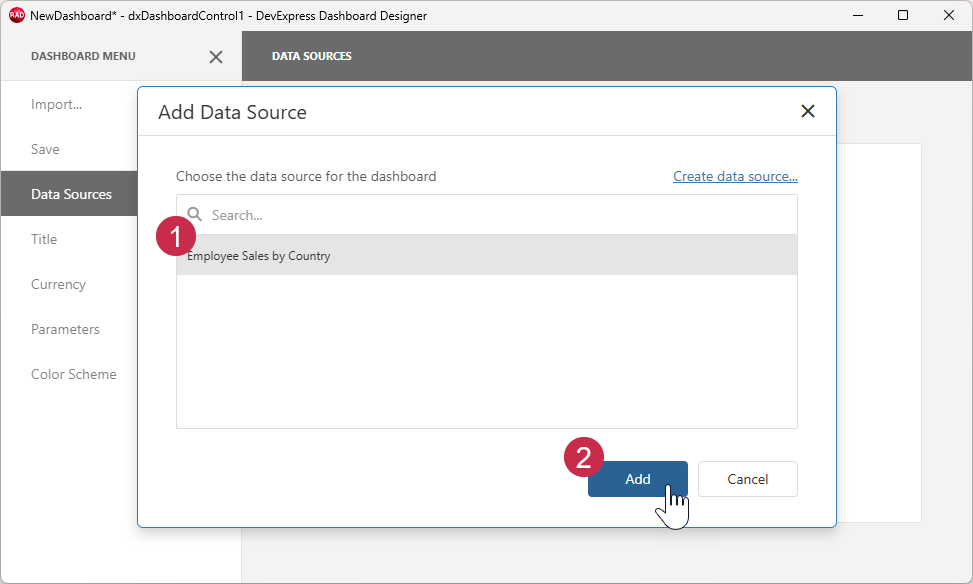
Select the configured data source and click Add:
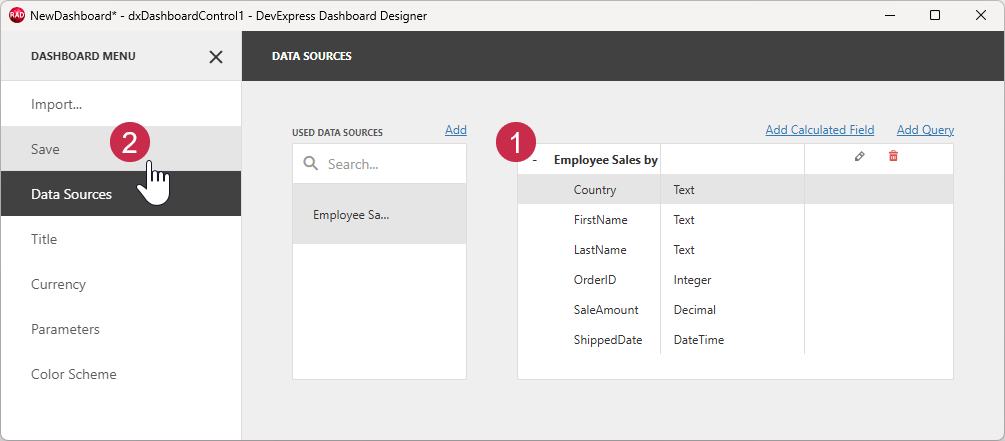
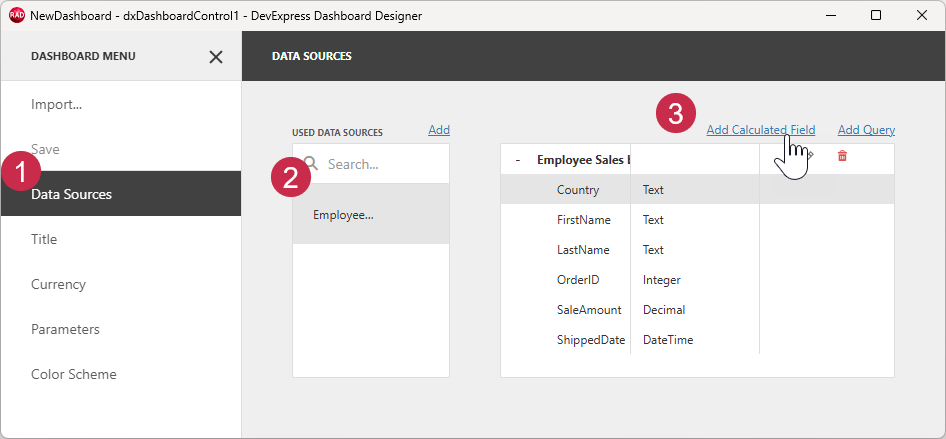
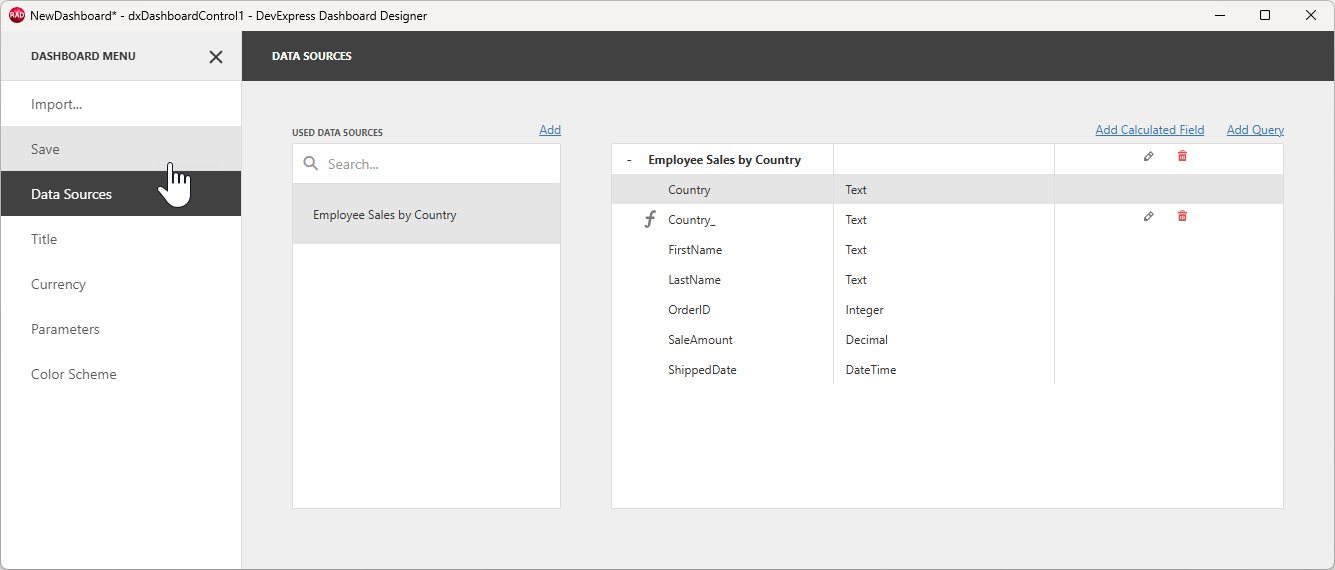
Review the loaded dataset fields in the DATA SOURCES pane and click the Save option to save the configured data source in the current dashboard layout:
Optional: Add a Calculated Field with European Country Names
The Country field in the Employee Sales by Country stored procedure has two possible country names: “US” and “UK”. To display a more diverse range of values for this tutorial, you can create a calculated field that maps nine surnames available in the Surname field to nine European country names.
- Return to the Data Sources pane.
- Select the configured data source.
- Click the Add Calculated Field button.
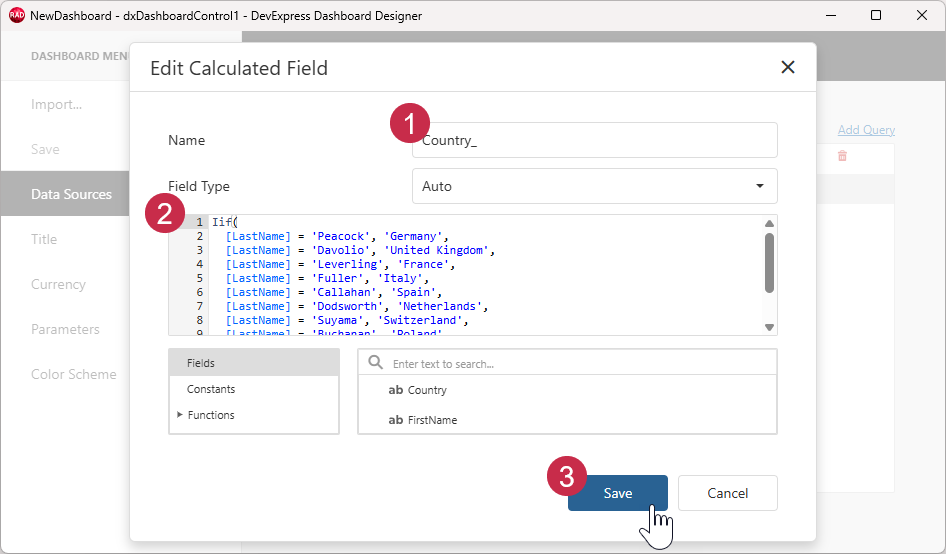
Edit the calculated field:
- Enter
Country_in the Name field. - Paste the code snippet demonstrated below in the Expression field. You can replace listed country names as required.
- Click Save to save the calculated field options.
Iif(
  [LastName] = 'Peacock', 'Germany',
  [LastName] = 'Davolio', 'United Kingdom',
  [LastName] = 'Leverling', 'France',
  [LastName] = 'Fuller', 'Italy',
  [LastName] = 'Callahan', 'Spain',
  [LastName] = 'Dodsworth', 'Netherlands',
  [LastName] = 'Suyama', 'Switzerland',
  [LastName] = 'Buchanan', 'Poland',
  [LastName] = 'King', 'Belgium',
  'Germany'
)
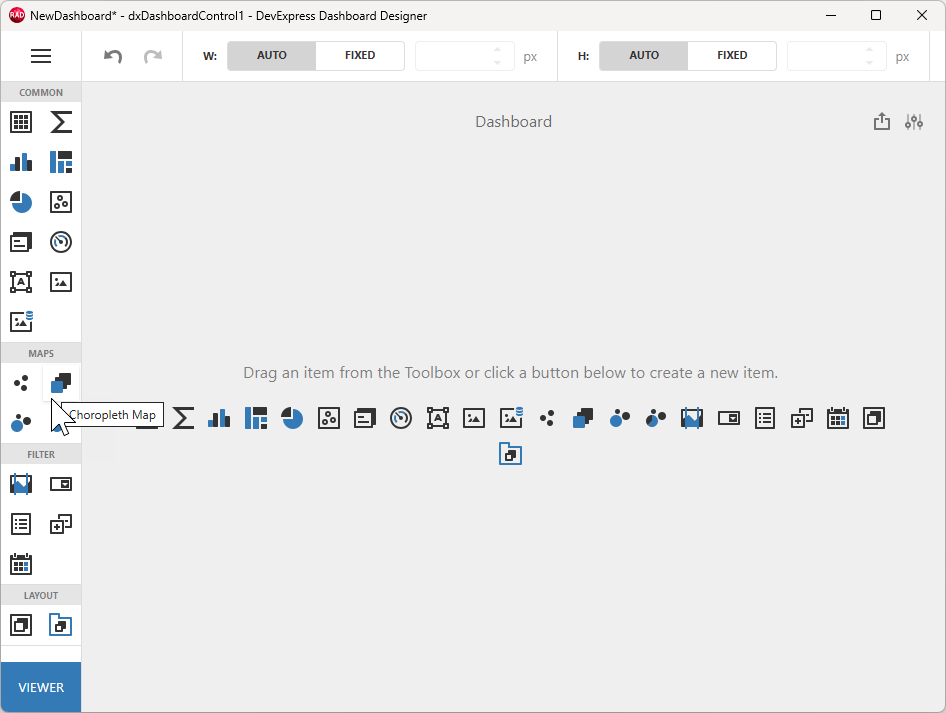
Step 3 — Add a Choropleth Map Item and Bind It to Data
A Choropleth Map item displays a map that allows you to colorize the required areas according to the underlying values.
Add and Configure a Choropleth Map Item
Add a Choropleth Map to the dashboard. Click the corresponding button within the Toolbox pane or in the empty dashboard area.
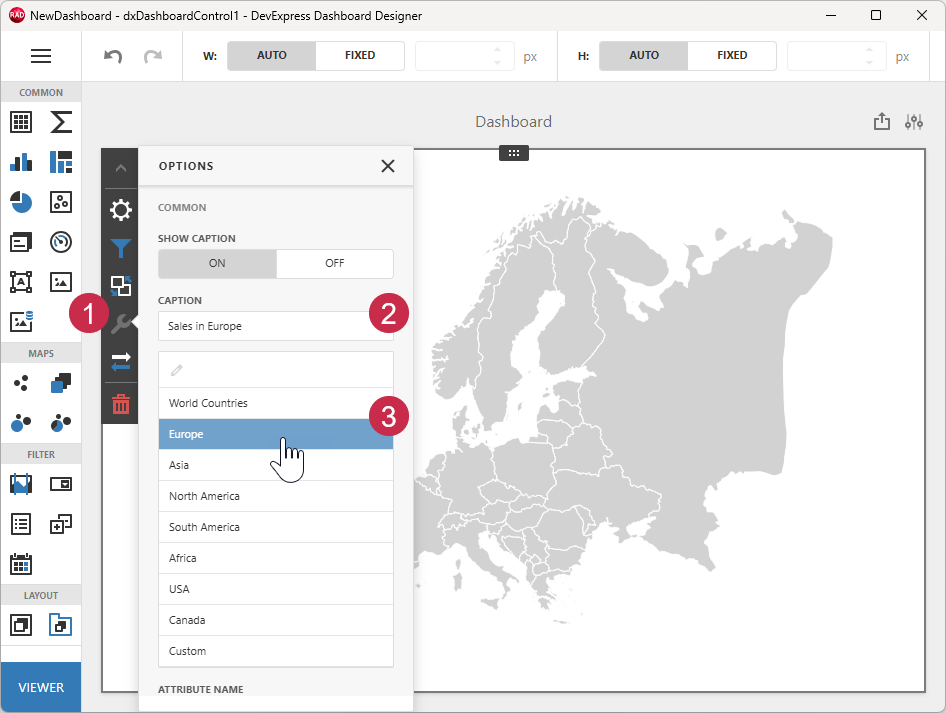
Click within the empty map area to select the created Choropleth Map item. Configure map options as follows:
- Click the Options (wrench) button to access map settings.
- Change the automatically generated map name to Sales in Europe.
- Select Europe to display data on a region-scale Europe map.
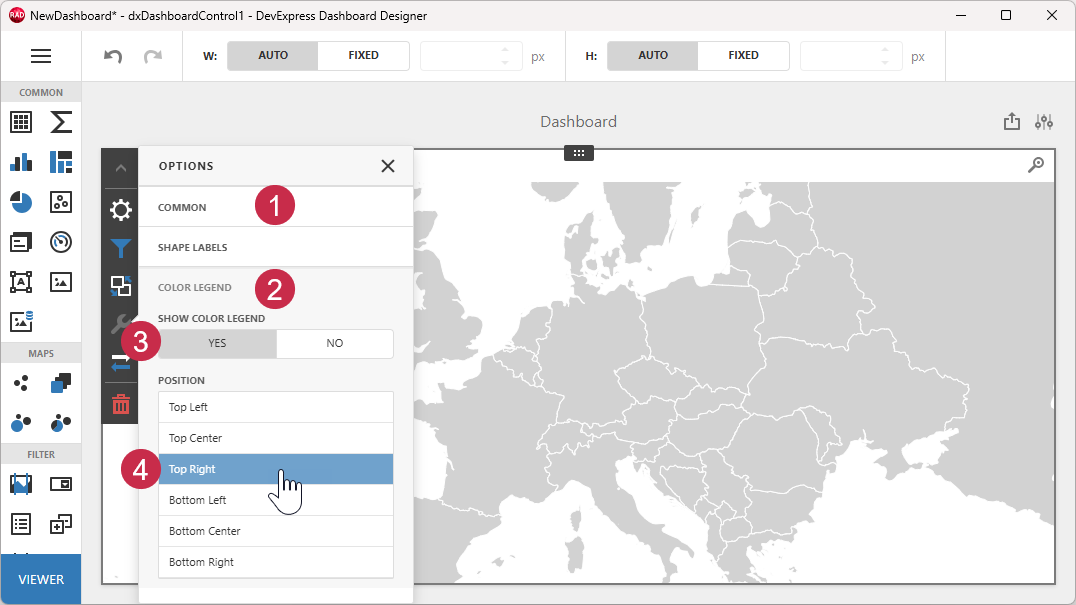
Add a color legend to the map:
- Collapse the Common options list.
- Expand the Color Legend options list.
- Select YES.
- Select the Top Right position.
Bind the Choropleth Map to Data
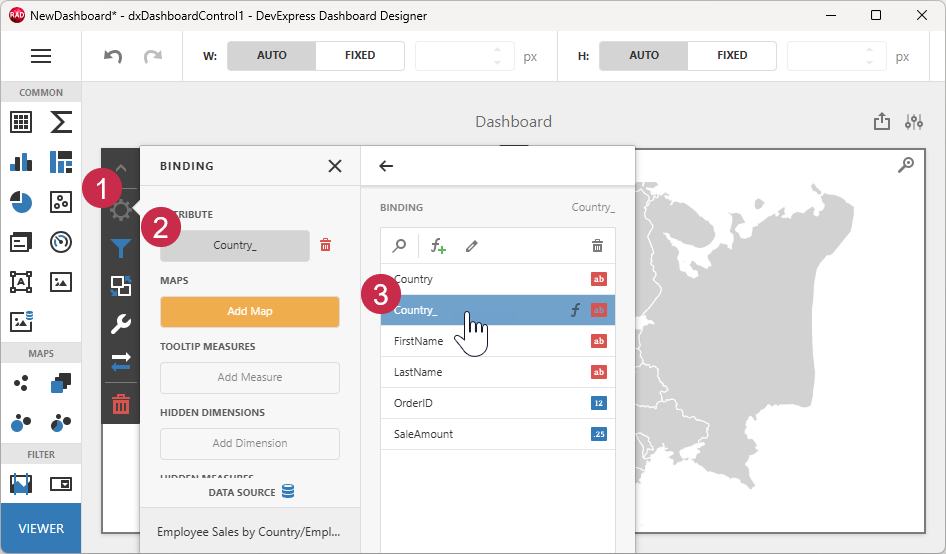
Bind the map to a data field that contains country names:
- Select the Binding (gear) button to display the data binding callout.
- Click the Set Attribute button under ATTRIBUTE and review the list of available data fields.
- Select the Country_ field.
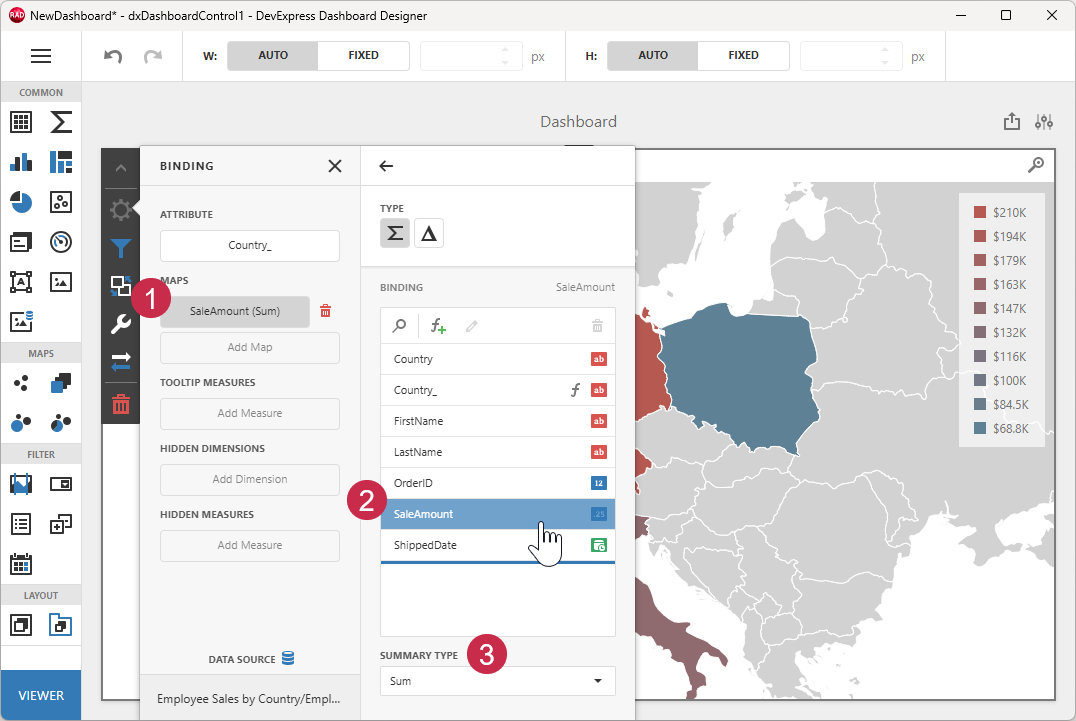
Bind the map to a data field that contains underlying values for the map:
- Click the Add Map button under MAPS.
- Select the SaleAmount field.
- Review the SUMMARY TYPE drop-down list. The Sum value specifies that the dashboard displays a sum of all field values filtered by country name.
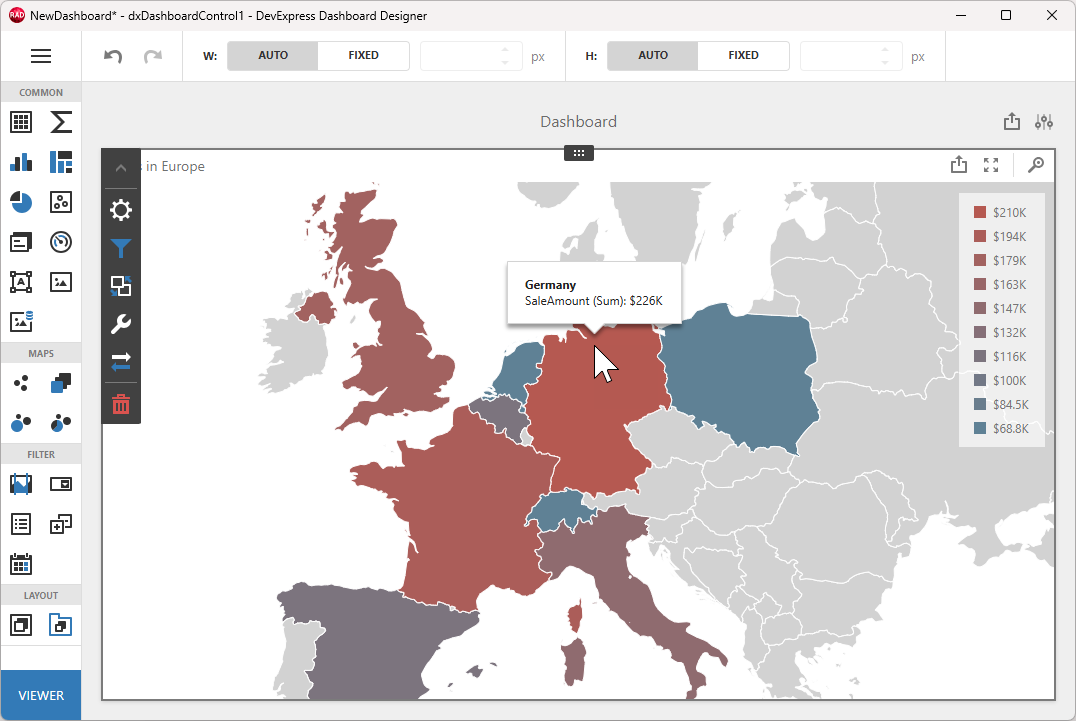
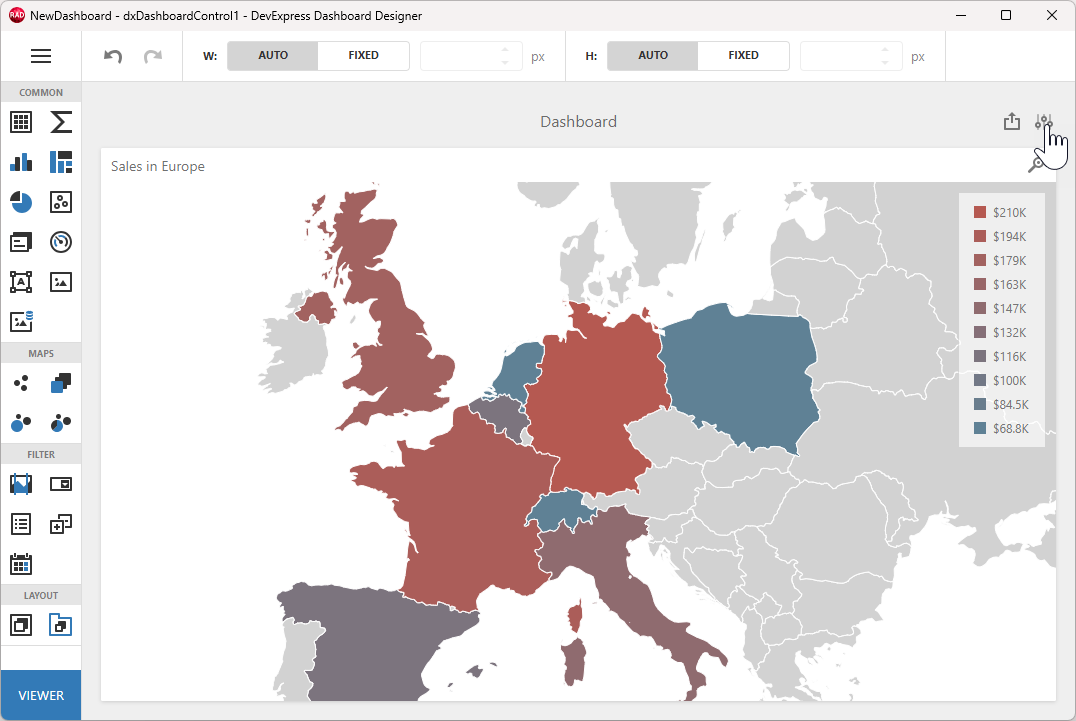
Review displayed data:
Step 4 — Create and Pass Dashboard Parameters to the Stored Procedure
The Employee Sales by Country stored procedure of the Northwind sample database has two input parameters:
@Beginning_Date and @Ending_Date.
You can pass dashboard parameters to the stored procedure to filter underlying dashboard data.
Create Dashboard Parameters
Create a “Beginning Date” parameter:
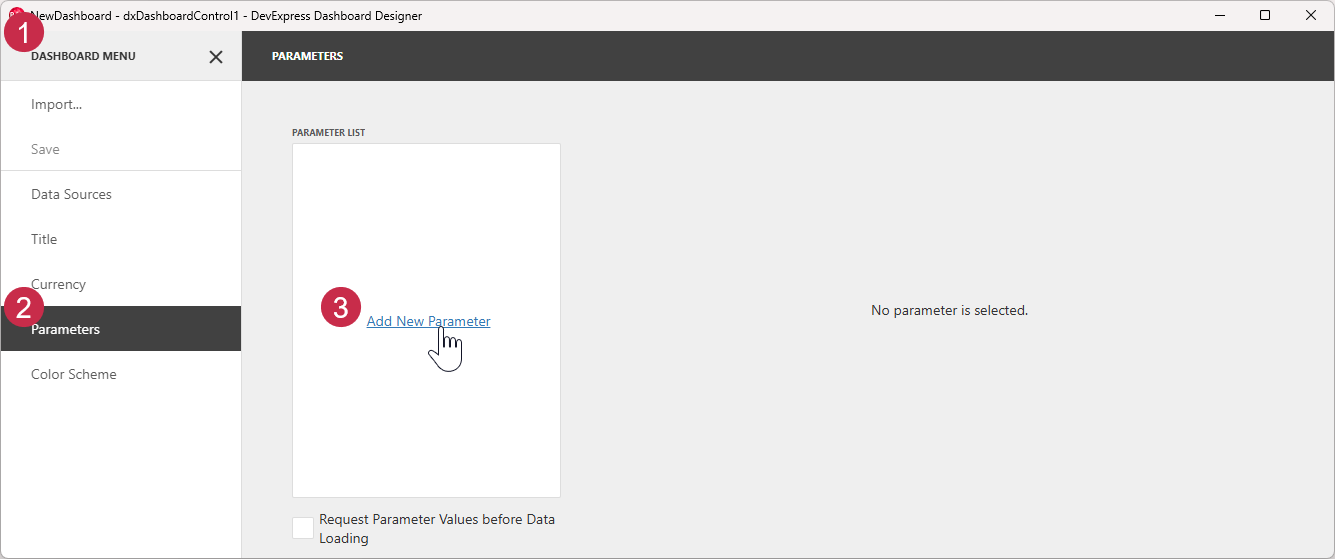
- Click the hamburger button to display the Dashboard Designer menu.
- Select Parameters to display the corresponding pane.
- Click Add New Parameter to add a new parameter and display parameter settings.
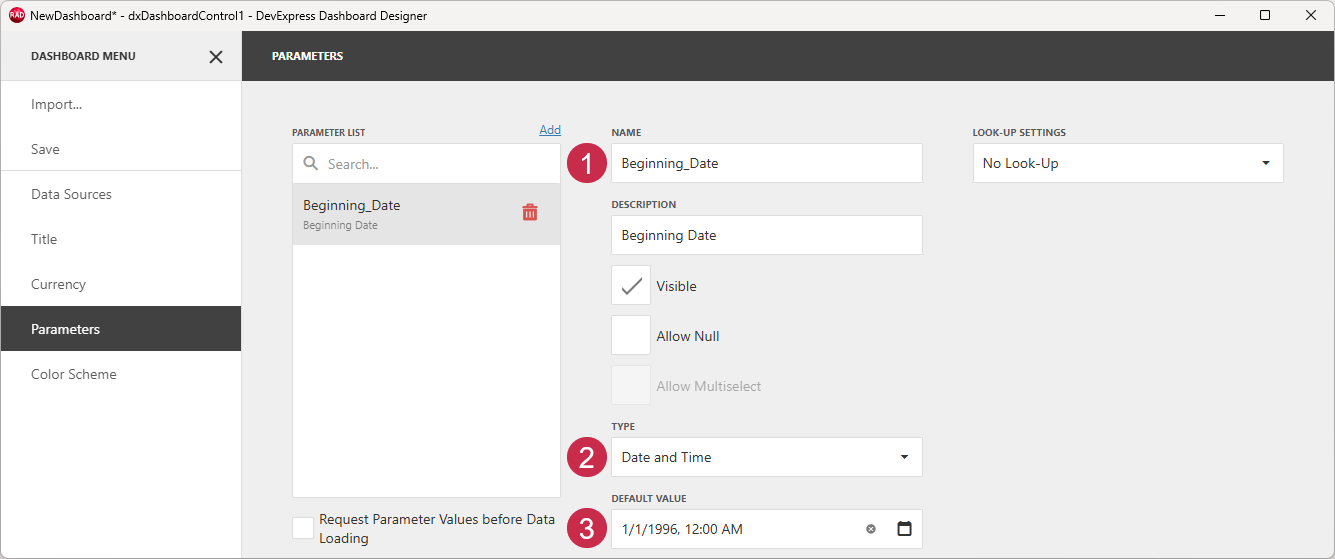
Specify parameter settings:
- Define the parameter’s Name and Description (display name).
- Select the Date and Time data type.
- Assign “1/1/1996 12:00 AM” to the Default Value field.
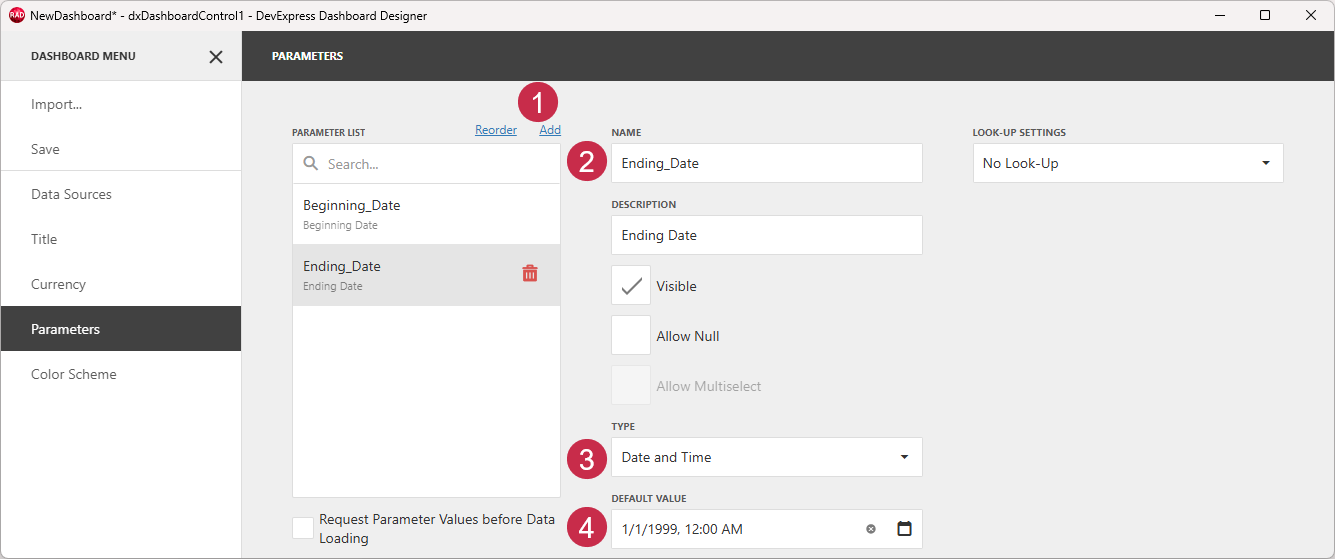
Repeat these steps to create an “Ending Date” parameter:
- Click Add to add a new parameter and display parameter settings.
- Define the parameter’s Name and Description (display name).
- Select the Date and Time data type.
- Assign “1/1/1999 12:00 AM” to the Default Value field.
Pass the Dashboard Parameter to the Stored Procedure
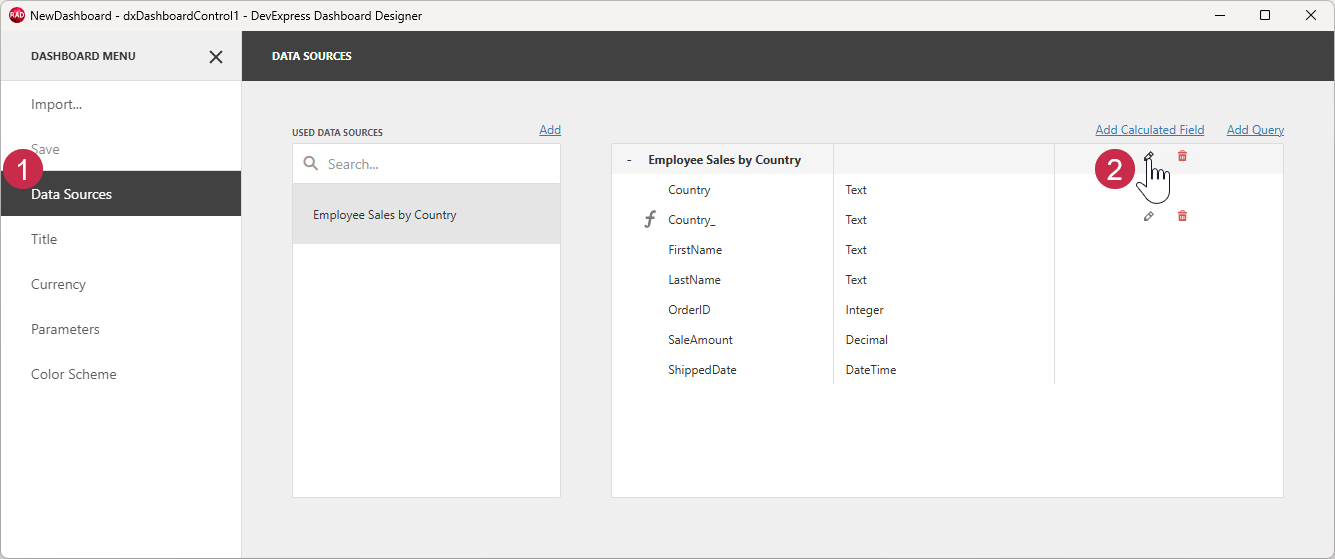
Display the Data Source Wizard:
- Select Data Sources to switch to the corresponding pane.
- Click the Edit (pencil) button next to Employee Sales by Country to display the Data Source Wizard.
Click Next to proceed to the Query Parameters dialog:
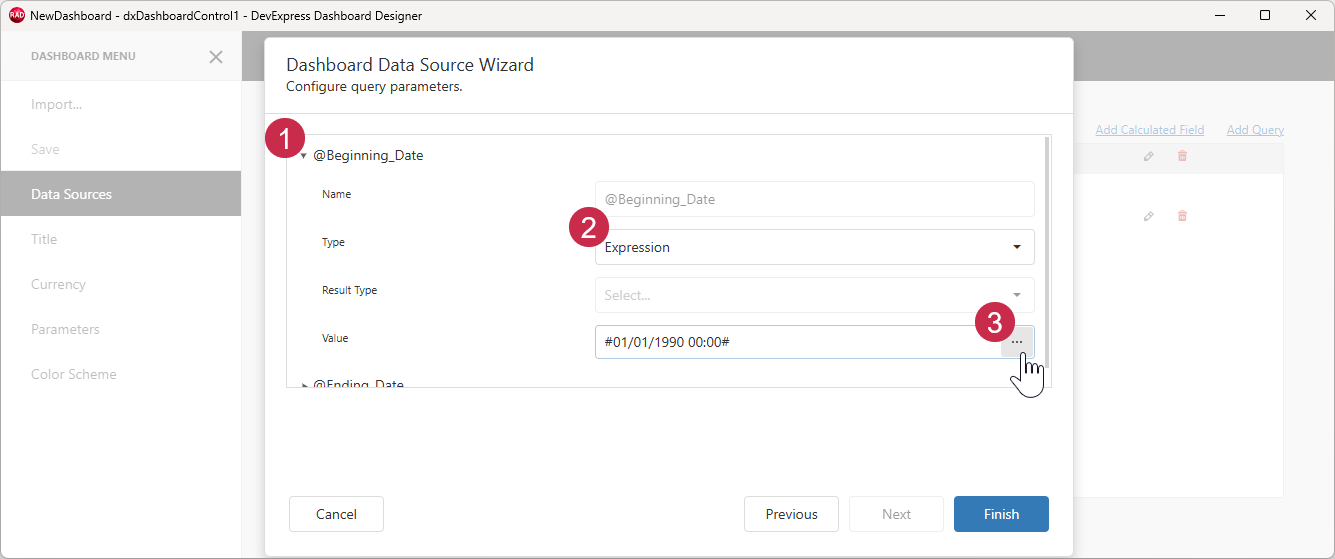
Edit the @Beginning_Date procedure parameter:
- Expand the
@Beginning_Dateparameter. - Select the Expression type.
- Click the ellipsis button next to the Value field to display the Expression Editor dialog.
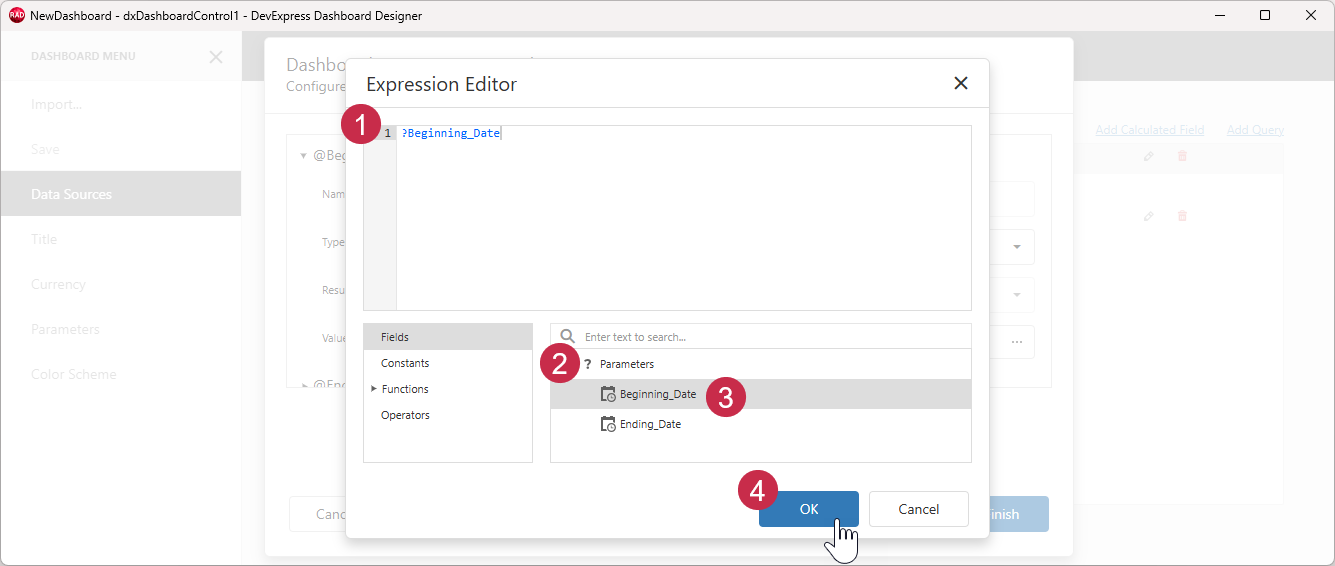
Pass the dashboard parameter to the procedure parameter:
- Clear the expression in the text field.
- Expand the Parameters list.
- Double-click the Beginning_Date dashboard parameter to add
?Beginning_Dateto the text field above. - Click OK to save the expression.
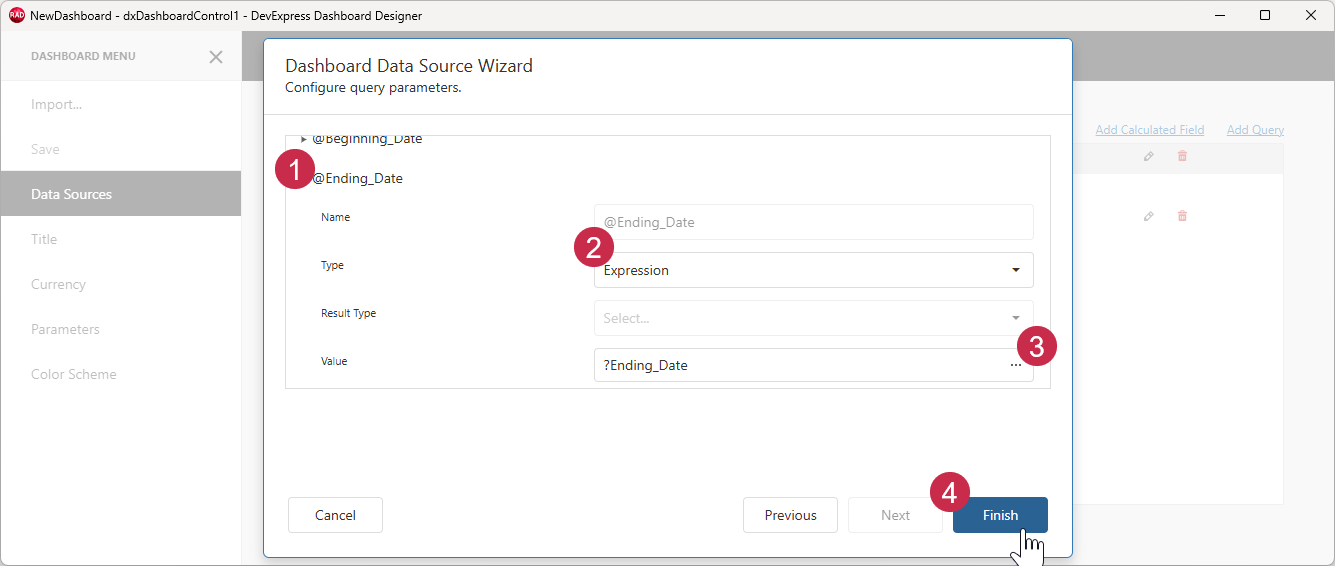
Repeat these steps to pass the ?Ending_Date dashboard parameter to the @Ending_Date procedure parameter:
- Expand the
@Ending_Dateparameter. - Select the Expression type.
- Click the ellipsis button to display the Expression Editor dialog or paste
?Ending_Dateinto the Value field. - Click Finish to save the data source parameter changes.
Click Save to save the updated dashboard layout and review the dashboard.
Step 5 — Modify Parameter Values and Review the Dashboard
Both Dashboard Designer and Dashboard Viewer dialogs include UI elements designed to modify parameter values and filter underlying dashboard data.
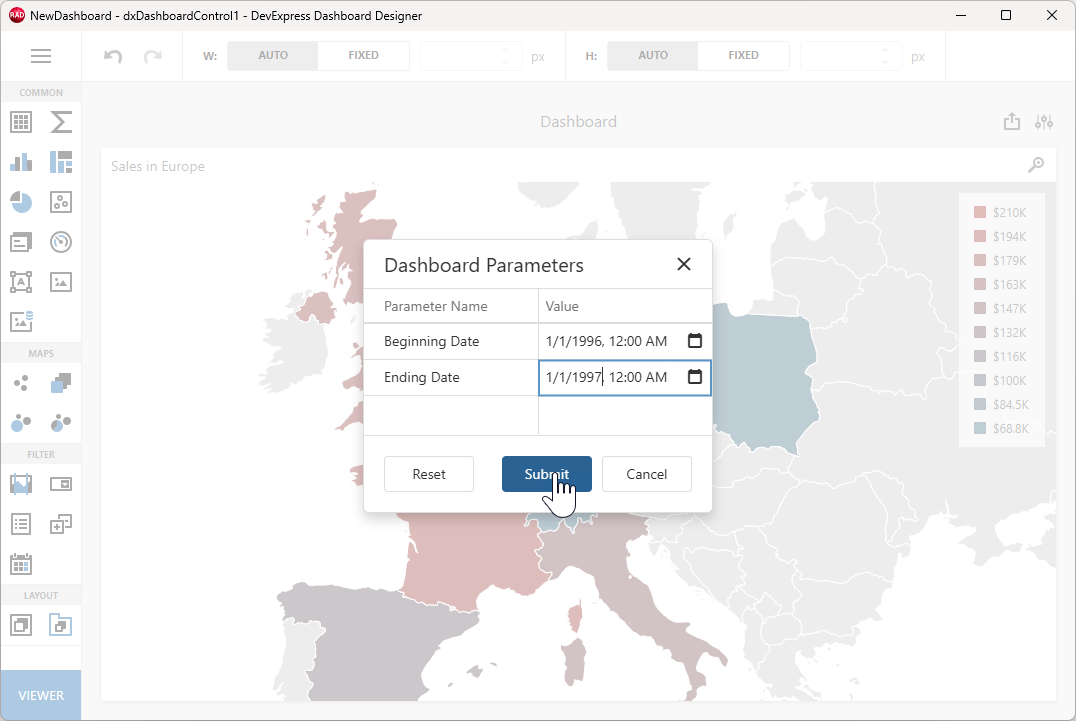
Click the Dashboard Parameters button to display the Parameters Dialog:
Assign 1/1/1999 12:00 AM to the Ending Date field to change the actual parameter value and click Submit:
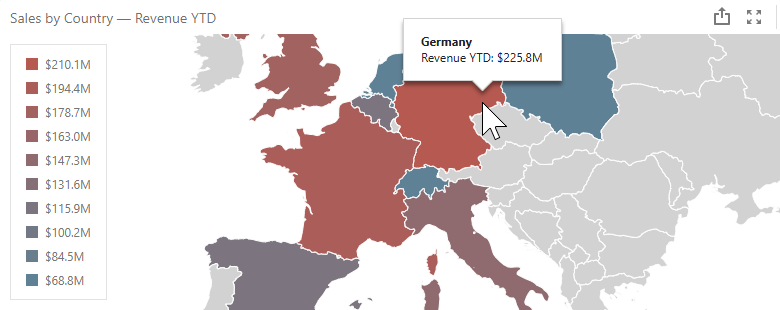
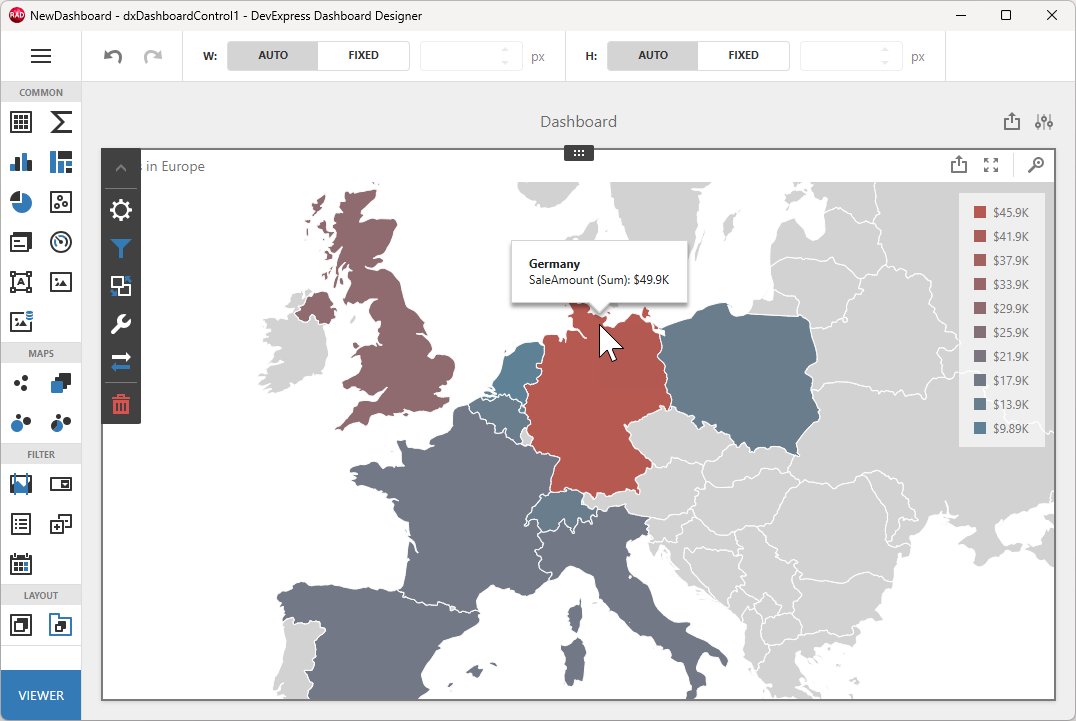
Review the dashboard that displays sales data for 1996 (the color legend and country tooltips are updated):
Next Steps
Build and Run Your Dashboard Application
All applications that include the TdxDashboardControl component require the WebView2 Runtime as a dependency. To automatically deploy this dependency using post-build events in the RAD Studio IDE, refer to one of the following topics:
Display Dashboard Viewer and Designer Dialogs at Runtime
To display Dashboard Designer/Dashboard Viewer dialogs at runtime, refer to the following GitHub-hosted application example:
Other Tutorials
- Basic Tutorial. Follow this tutorial to create a simple dashboard application: set up a memory-based data source, load JSON data, create Bubble Map and Chart dashboard items, and bind them to data.
- Follow this tutorial to create a dashboard and bind it to data using standard FireDAC components (TFDQuery and TFDConnection) shipped with the RAD Studio IDE.
-
Alternatively, you can double-click the TdxDashboardControl component while content is hidden or unavailable at design time.
If you display dashboard content at design time, right-click the selector at the bottom-right corner of the TdxDashboardControl area.