Bind a Dashboard to a Database/SQL View Using Standard FireDAC and DataSet Components
- 5 minutes to read
This tutorial creates a new project, sets up FireDAC components shipped with the RAD Studio IDE, adds a TdxDashboardControl component, and uses the Dashboard Designer dialog to add data-bound Bubble Map and Chart dashboard items to the layout.
Sample SQLite Database
This guide uses the following SQLite database shipped with compiled DevExpress VCL demos:
Tip
%PUBLIC%\Documents\DevExpress VCL Demos\MegaDemos\Product Demos\ExpressReports\Data\devav.sqlite3
Step 1 — Create & Configure a RAD Studio Project
Create a new Delphi or C++Builder project.
Place Components on a Form
DevExpress Components
- TdxBackendDataConnectionManager
- Manages data sources for all dashboards in your application.
- TdxDashboardControl
- A VCL Dashboard control designed to display and autoarrange data analysis elements, such as grids, charts, maps, gauges, etc.
FireDAC Components
- TFDConnection
- A standard component designed to establish a connection to a database management system.
- TFDQuery
- A dataset component designed to execute SQL queries.
- TDataSource
- An interface component designed to connect datasets and data-aware components/controls on a form.
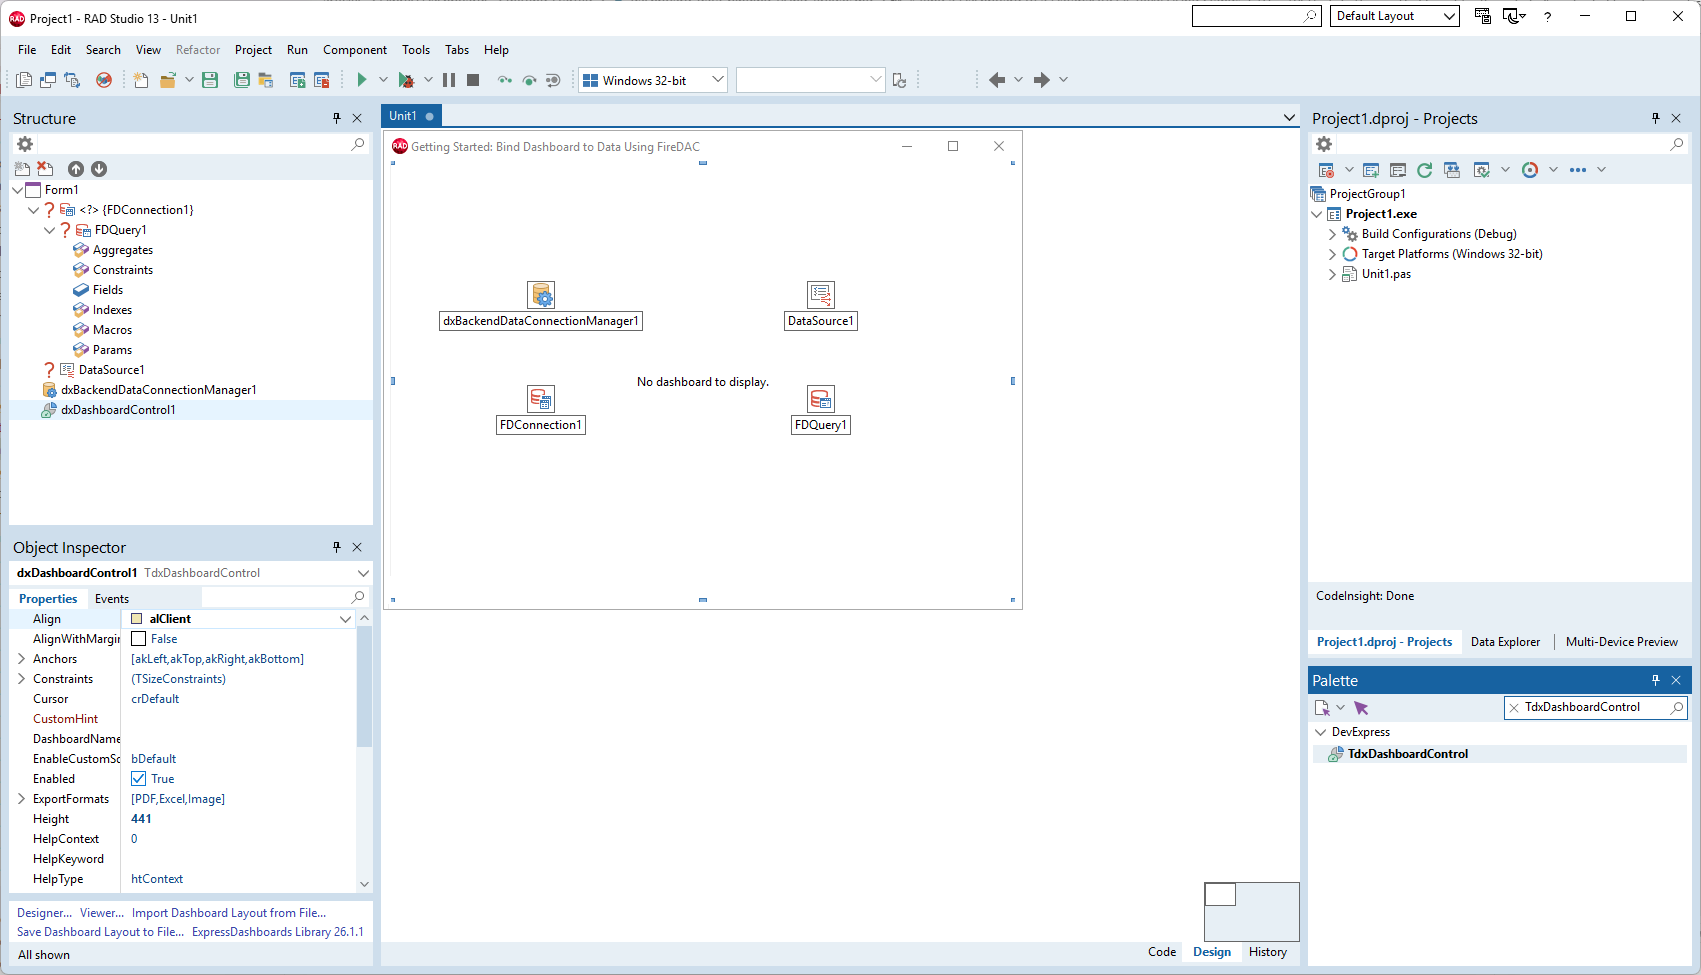
Configure FireDAC Components
FireDAC Connection
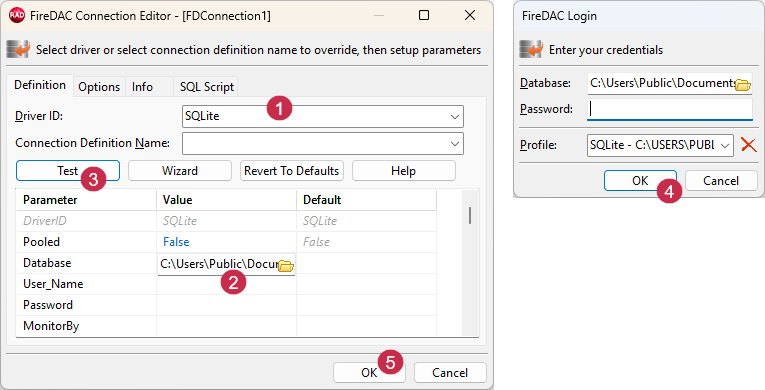
Right-click the TFDConnection component and select Connection Editor… to configure the database connection:
- Select SQLite in the Driver ID combo box.
- Click the folder icon for the Database parameter to display the Open File dialog and select the sample SQLite database file.
- Click Test to check if the sample SQLite database (devav.sqlite3) is accessible.
- Leave the Password field empty and click OK in the FireDAC Login dialog to ensure that the connection is established successfully.
- Click OK to close the Connection Editor… dialog.
FireDAC Query
- Double-click the TFDQuery component to display the FireDAC Query Editor dialog.
Paste the following SQL query into the command editor:
SELECT * FROM CUSTOMERSClick Execute to fetch corresponding records from the sample SQLite database:
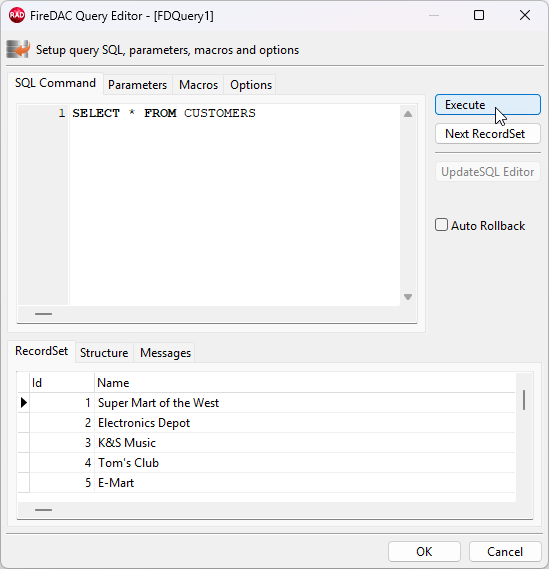
Close the FireDAC Query Editor dialog and enable the Active property in the Object Inspector.
Data Source
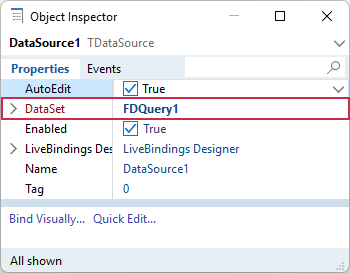
Select the TDataSource component and assign the configured TFDQuery component to the DataSet property using the Object Inspector.
Bind the Dashboard Control to Data
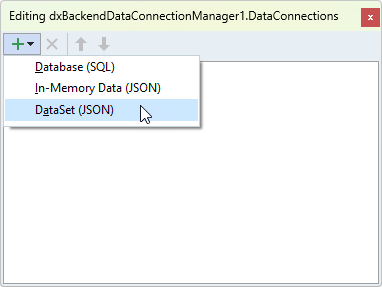
Double-click the TdxBackendDataConnectionManager component on the form to open the Collection Editor dialog, click the Add button, and select the DataSet (JSON) option to create a TdxBackendDataSetJSONConnection component:
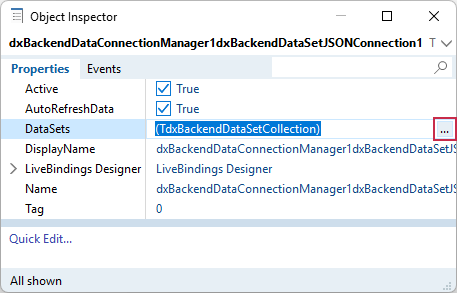
Select the created component and click the ellipsis button for the TdxBackendDataSetJSONConnection.DataSets property in the Object Inspector to display the Collection Editor dialog.
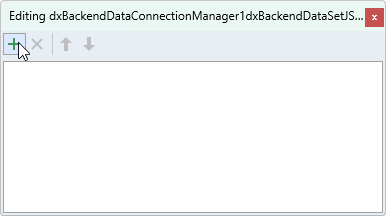
Click the Add New button to create a dataset link (TdxBackendDataSetCollectionItem) for the TdxBackendDataSetJSONConnection component:
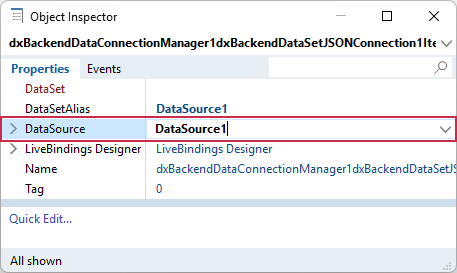
Select the created TdxBackendDataSetCollectionItem component and use the Object Inspector to assign the previously configured TDataSource component to the TdxBackendDataSetCollectionItem.DataSource property:
The sample SQLite database is now accessible to the TdxDashboardControl component.
Step 2 — Add the Configured Data Source to the Dashboard Layout
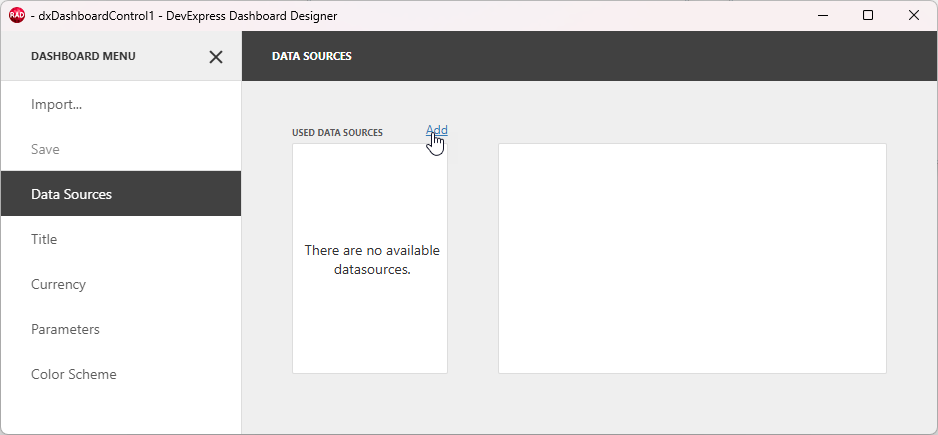
Right-click the TdxDashboardControl and select the Designer… option[1] to display the Dashboard Designer dialog. Click the hamburger button in the upper-left corner and select Data Sources to display the corresponding pane.
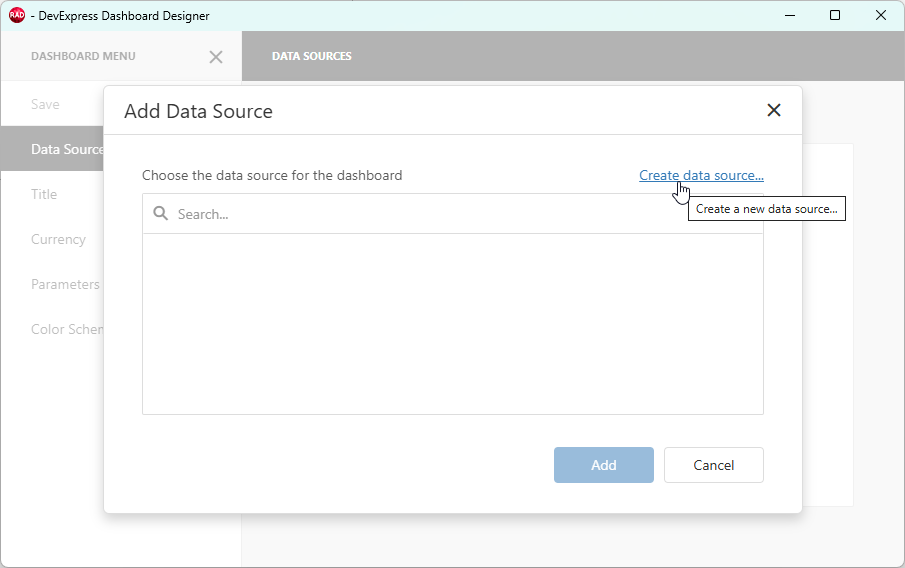
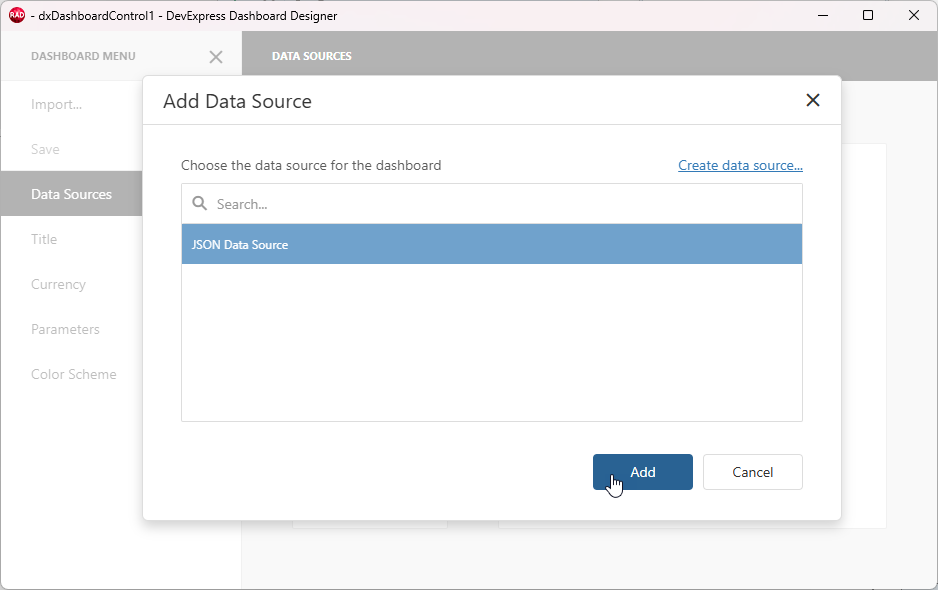
Click Add to display the Add Data Source dialog:
Click Create data source… in the Add Data Source dialog to display the Data Source Wizard.
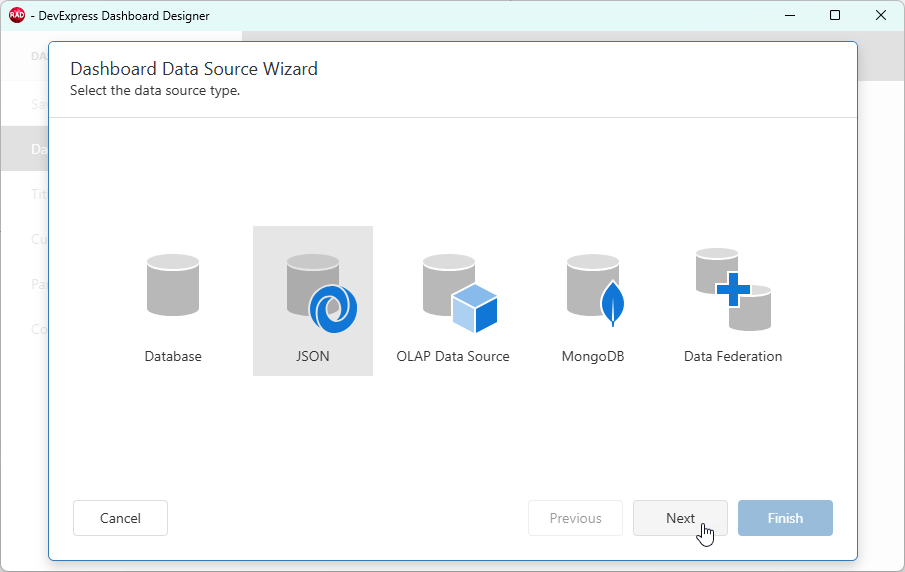
Select JSON as the data source and click Next.
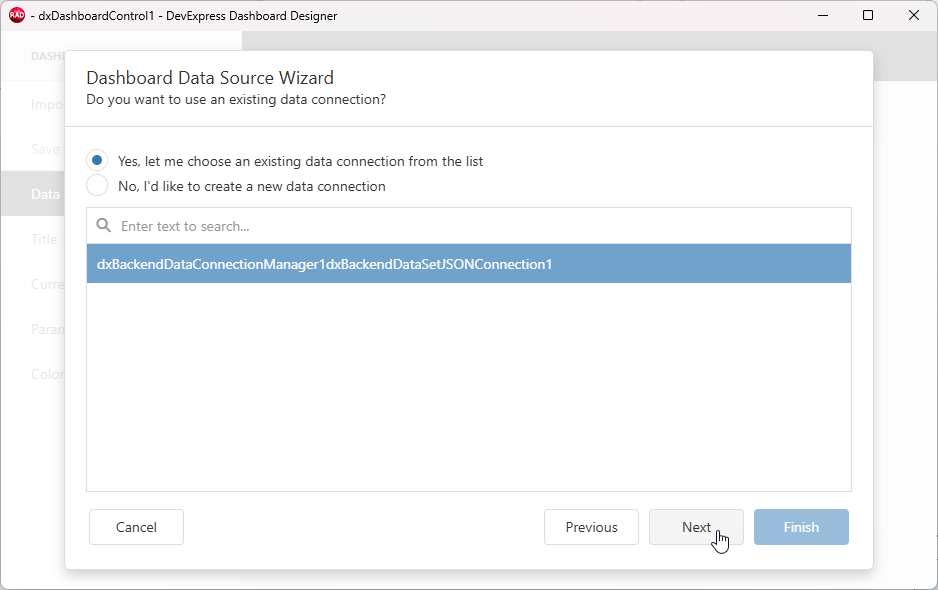
Select the previously configured dataset connection component and click Next.
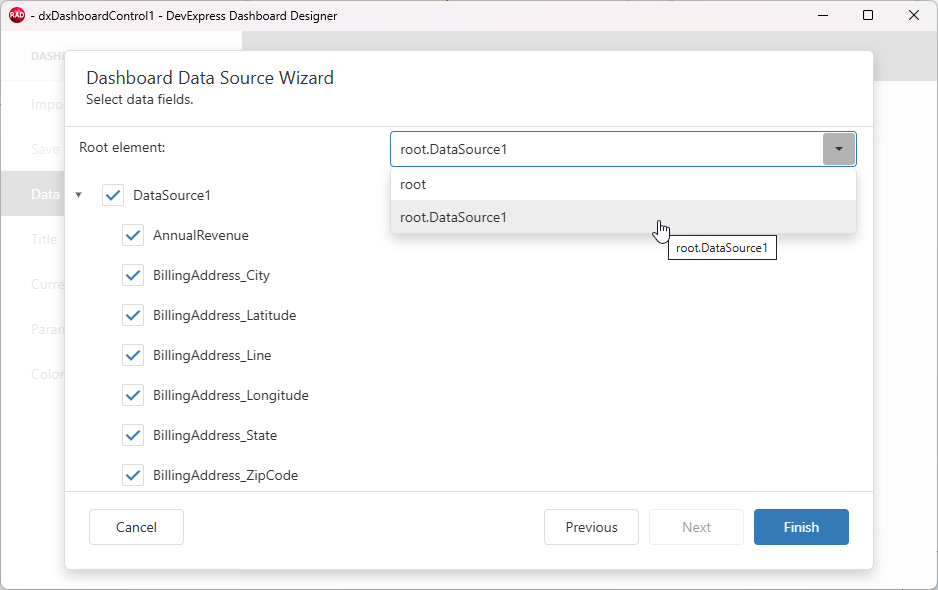
Switch the Root element combo box from root to root.DataSource1 and click Finish.
Select the configured data source and click Add.
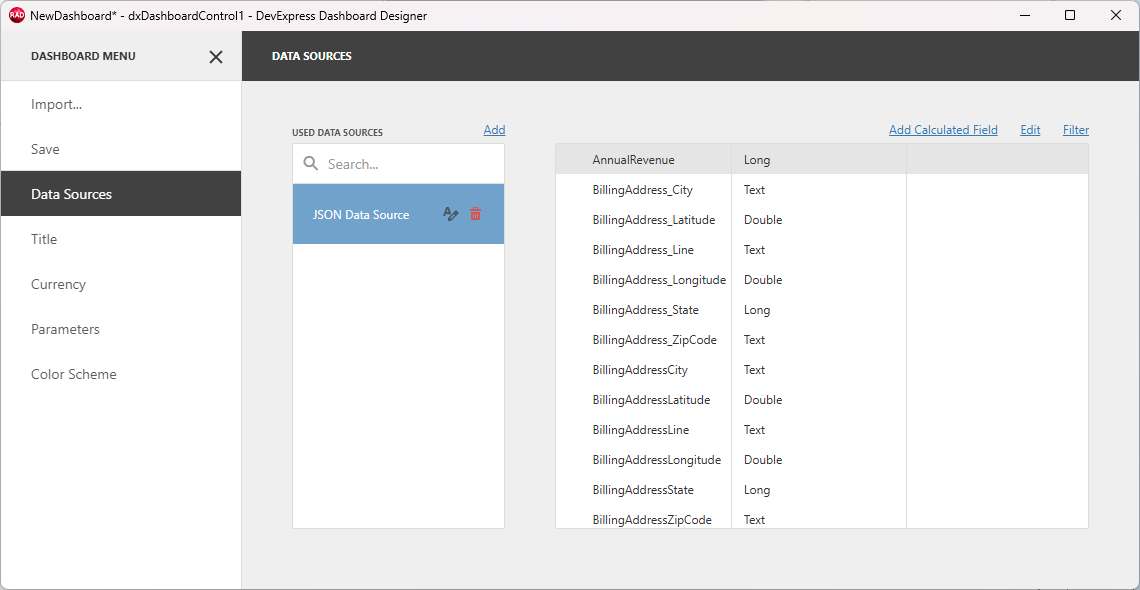
Review the loaded dataset fields in the DATA SOURCES pane and click the Save option to save the configured data source in the current dashboard layout.
Next Steps (3, 4, and 5)
To add dashboard items and bind them to the configured data source, and deploy the resulting applications, follow steps 3, 4, and 5 of the basic Dashboard Tutorial:
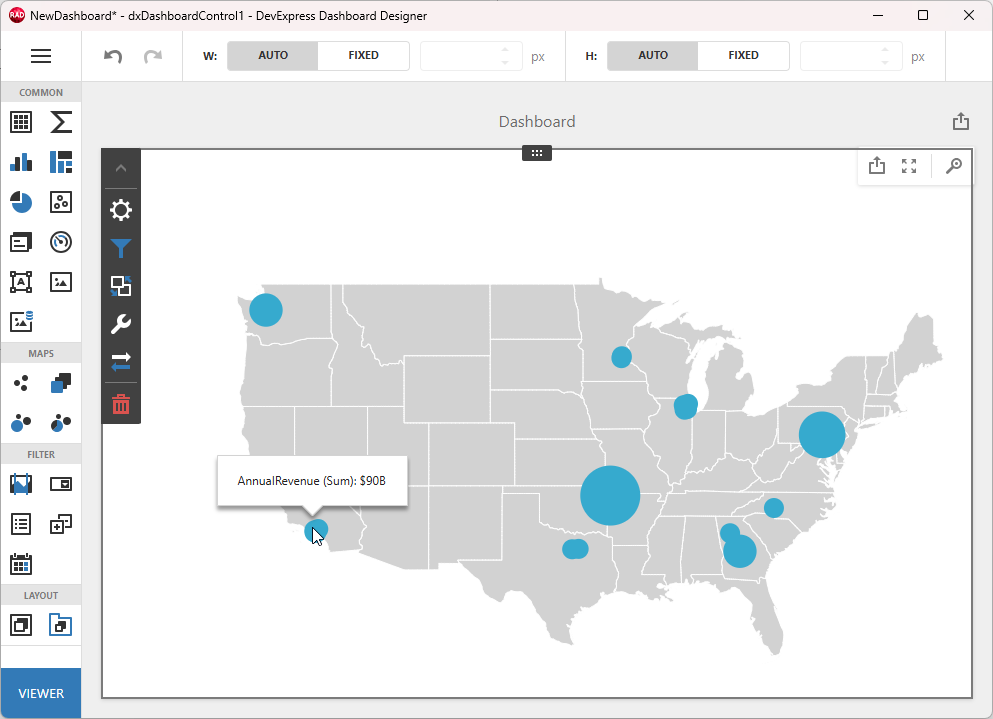
- Step 3 — Create a Bubble Map Item and Bind It to Data
- Adds and configures a Bubble Map dashboard item.
- Step 4 — Create a Chart Item and Bind It to Data
- Adds and configures a Chart dashboard item.
- Step 5 — Build & Run Your First App
- Explains how to use post-build events in the RAD Studio IDE for automatic dependency deployment for the TdxDashboardControl component.
Other Tutorials
- Basic Tutorial. Follow this tutorial to create a simple dashboard application: set up a memory-based data source, load JSON data, create Bubble Map and Chart dashboard items, and bind them to data.
- Follow this tutorial to create a dashboard, bind it to a parametrized stored procedure, and pass dashboard parameters to that procedure using the Dashboard Designer dialog at design time.
-
Alternatively, you can double-click the TdxDashboardControl component if content is hidden or unavailable at design time.
If dashboard content is visible at design time, right-click the green selector at the bottom-right corner of the TdxDashboardControl area to display the component menu.