Creating Data Groups in Chart Views
- 4 minutes to read
This topic describes the methods used to create data groups in Chart Views. The examples that are referred to herein are based on the MasterDetailChartDemo that is shipped with the ExpressQuantumGrid.

By exploiting the data grouping capability of Chart Views, you can design a multilevel (hierarchical), interactive Chart, without the need to implement data-drilling since both the drill-down and drill-up functionality is built directly into the control.
Creating Data Groups at Design Time
In this demo, the chvOrders detail Chart View (see the Orders page) initially displays information on payments grouped by orders. To group series values by payment type, create a new data group and bind it to the PaymentType field as described below.
Click the chvOrders label in the Structure Navigator and then click the Customize… button to invoke the Component Editor.

Open the DataGroups page by clicking the corresponding tab in the Component Editor.

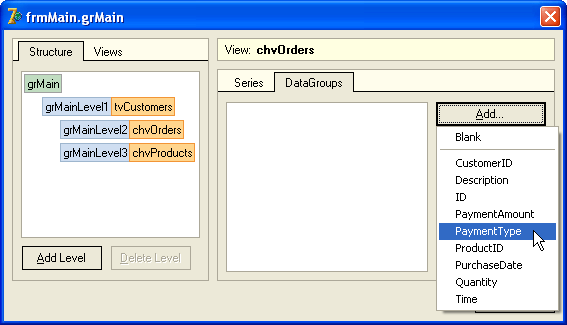
Click the Add… button to add a data group. This will display a dropdown menu which lists all data source fields. Choose the PaymentType field.
This creates the required data group and automatically updates the View. Now values are grouped by the payment type.
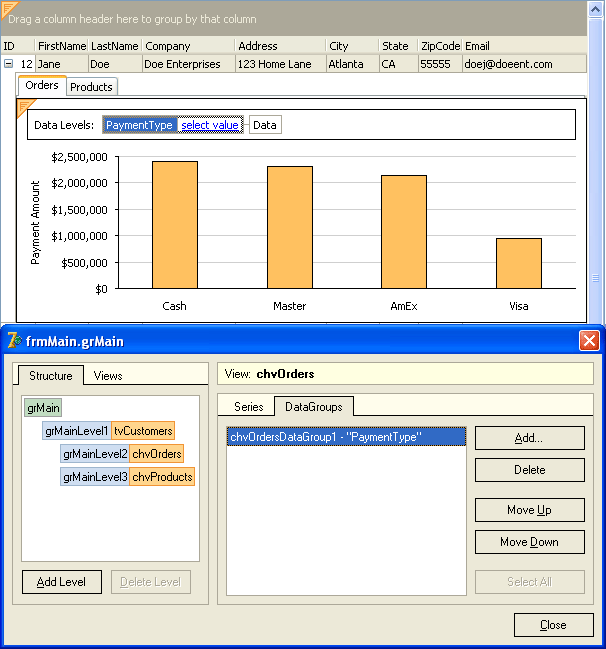
Note that chvOrdersPaymentAmountSeries series values - which displays payment amounts - are summarized because the GroupSummaryKind property of this series is set to skSum by default. You can specify a different computation as your needs dictate.

When adding a data group, the chart toolbox appeared on-screen. It displays the data level navigator (labeled as ‘Data Levels’). This element provides drill-down functionality for end-users. The default values of the View’s ToolBox.Visible and ToolBox.DataLevelsInfoVisible properties allow the chart toolbox and data level navigator to be displayed when at least a single data group is visible in a Chart View.
When running, the MasterDetailChartDemo displays the pound (#) symbol which precedes the captions of category values. This modification is done in the View’s Categories.OnGetValueDisplayText event handler.
Remove this handler to display the captions of category values as is.
To explore the drill-down functionality, let’s create a second-level group. At this level, we’ll aggregate the data by the purchase date. To do this, open the Component Editor and add the data group bound to the PurchaseDate field. Note that the PaymentType field associated with the first-level data group remains checked in the Add… dropdown menu.

This adds the required data group to the list and creates the corresponding data level in the data level navigator.

You can change the display order of data groups in the list by clicking the Move Up and Move Down buttons. This results in a change to the hierarchy (see below):

Alternatively, you can drag data levels in the data level navigator to change the hierarchy of the grouped data. End-users are able to do this at runtime provided that the View’s OptionsCustomize.DataGroupMoving property is set to True. Note that the label (‘Data’), which corresponds to default categories cannot be moved in this manner since it represents the highest level of detail.
You can customize the caption of this label using the View’s Categories.DisplayText property. At design time, you can click this visual element to display the properties of the default categories in the Object Inspector.
End-users can drill down on the aggregated value either by clicking the corresponding data marker or selecting a value from the list available for each data group (called a data group active value). To drill up, end-users can right-click anywhere on the chart or click a data level’s label in the data level navigator. Use the View’s OptionsCustomize.DataDrillUpMethod property to specify the manner in which a drill-up can be performed.
To learn more about groups and group summaries in tabular Views, and data groups and aggregate values in Chart Views, run the ChartDataDrillingDemo that is shipped with the ExpressQuantumGrid.
Creating Data Groups at Runtime
To programmatically add a data group to a Chart View, you should call the View’s CreateDataGroup method. To map this data group to a specific field in the bound dataset, use the DataBinding.FieldName property. The Index property of the data group allows you to specify the visual position of this data group and the corresponding data level in the data level navigator of a chart toolbox.
The following code snippet demonstrates how to create PaymentType and PurchaseDate data groups. Note that the PurchaseDate data group is positioned as the first visible data group.
with chvOrders.CreateDataGroup do
    DataBinding.FieldName := 'PaymentType';
  with chvOrders.CreateDataGroup do
  begin
    DataBinding.FieldName := 'PurchaseDate';
    Index := 0;
  end;
The resulting View is shown in the image below:
