ExpressFlowChart Tutorial. Step 2: Create Chart Symbols
In this step, you start with the fully configured flow chart control.
To create a chart at design time, you can use the ExpressFlowChart editor. Double-click the control to display the editor.
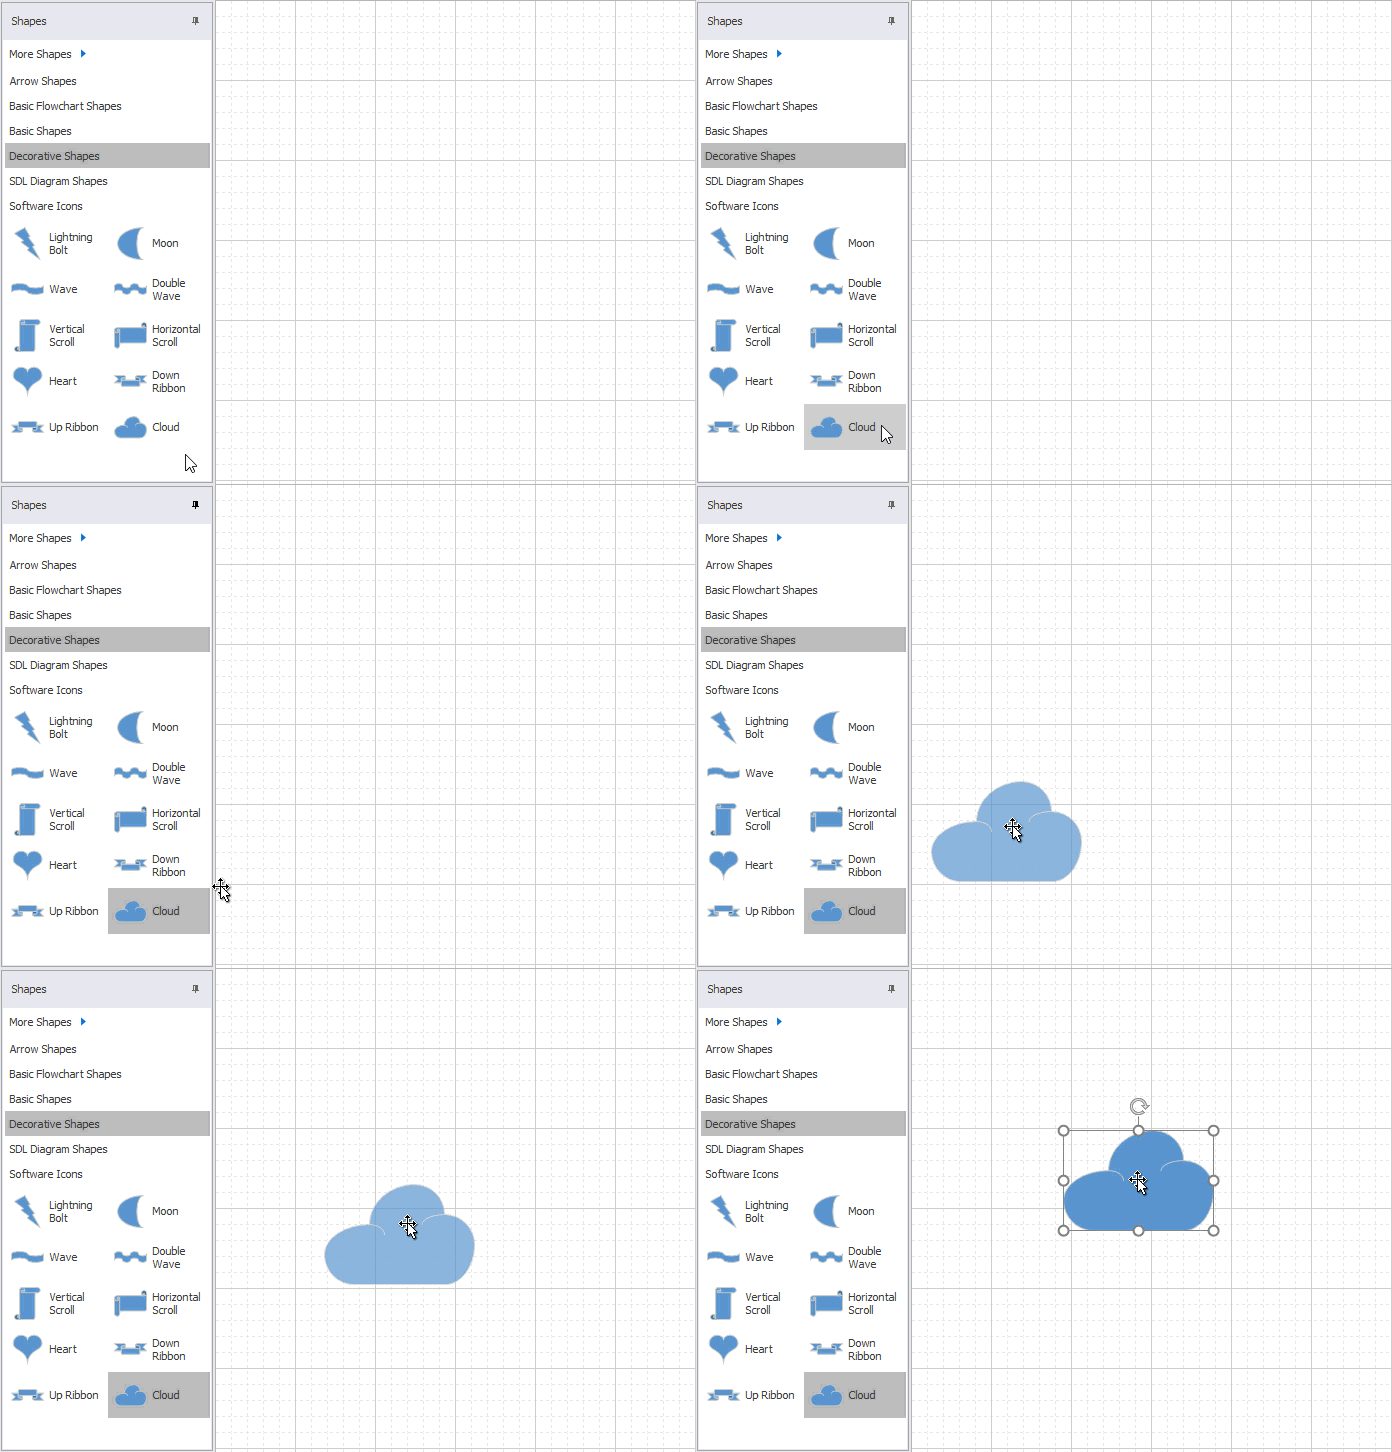
To add a chart symbol to the editor’s area, drag and drop the desired shape template from the Shapes pane to the area.

You can customize the chart symbol appearance via the “Edit Object“ dialog. To invoke it, double-click the required element within the editing area or click the Properties context menu item.
The “Edit Object” dialog includes the General, Image and Frame tabs.

You can use the General tab to specify a chart symbol’s dimensions, text settings, background and/or outline color.
The Image tab displays the content of the image list associated with the flowchart control in the first step.
The Frame tab provides the functionality for setting the additional shadow effects of the chart symbol.
The image below shows the resulting layout of chart symbols:

To demonstrate the document flow process, you need to tie the corresponding chart symbols via connections as shown in the next step.