VCL Pivot Grid
- 3 minutes to read
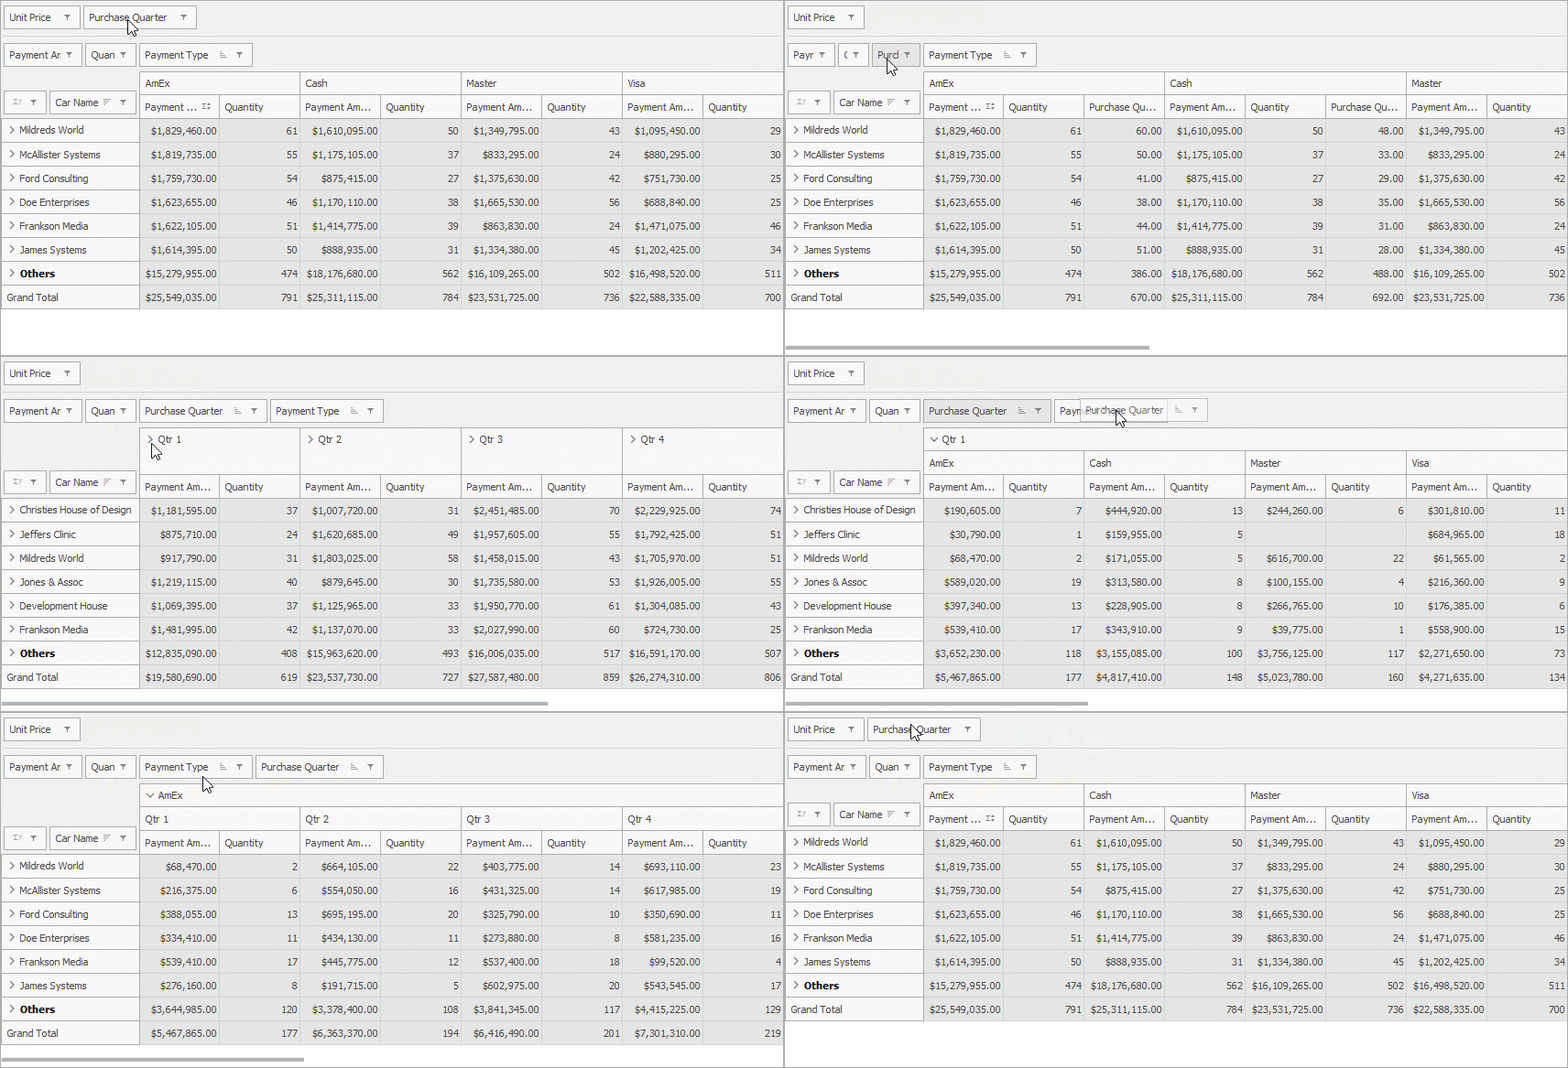
The VCL Pivot Grid emulates Microsoft Excel’s Pivot Table UI. It helps you display a variety of summarized views based on raw data. Users can change the view layout and shape data at runtime.

Bind to Data
The Pivot Grid supports the following data access modes:
- Bound Mode
Data is stored in a relational data storage. The Pivot Grid loads all data from the bound dataset to the client.
Refer to the following topics for additional information:
- Unbound Mode
- The Pivot Grid is not bound to a dataset and manages data preloaded into the data controller.
- Provider Mode
- Data is stored in a custom data source. Create a TcxCustomDataSource descendant and override the GetRecordCount and GetValue methods to use this mode.
- OLAP Mode
The Pivot Grid loads and displays multidimensional data from Microsoft Analysis Services data sources (OLAP cubes). You can store an OLAP cube in the local file system or deploy it to Microsoft SQL Server. Refer to the following topics for detailed information on how to work with OLAP cubes:
Data Shaping
The Pivot Grid control has the following data shaping options:
- Filter Data
The prefilter panel and filter dropdowns allow users to filter data that meets certain criteria.

- Group Data
If you place a field into the row or column area, the Pivot Grid automatically groups field values. You can place multiple fields in the same area to enable a hierarchical display.

- Summaries
The Pivot Grid’s internal logic specifies the default summary type to apply to different field types. You can change the summary type to any built-in summary function or implement a custom summary calculation algorithm.
Refer to the following topic for more information on summaries:
Tip
You can link the TcxPivotGridSummaryDataSet component to the Pivot Grid to display calculated summaries in another data-aware control.
- Sort Data
The Pivot Grid can sort data based on column and row header values, or based on the corresponding summary values.

Refer to the following topics for details:
- Totals and Grand Totals
The Pivot Grid can calculate totals against entire rows/columns and against individual groups (if you enable hierarchical data display).

Refer to the following topics for details on supported total types:
Data Analysis
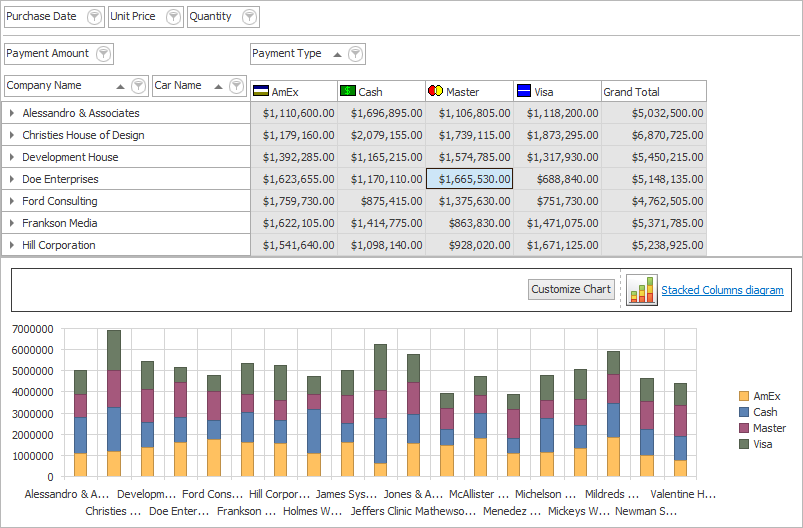
The Pivot Grid can display its data in an unbound Chart View of the VCL Data Grid.

Tip
The Data Grid control required to display data as a chart is installed separately. Refer to the TcxPivotGridChartConnection component description for detailed information.
Export Data
You can export the Pivot Grid’s content to a file in the following formats:
- Office Open XML (XLSX and XLTX)
- Comma-separated values (CSV)
- Plain text (TXT)
- HyperText Markup Language (HTML)
- Extensible Markup Language (XML)
- Excel Binary File Format (XLS and XLT)
Refer to the following topics for additional information: Data Export.