Summaries
- 3 minutes to read
The ExpressPivotGrid control supports automatic and custom summaries. Summaries are always calculated against data fields. Automatic summaries are calculated using the field values of the corresponding data fields, while custom summaries can be calculated using the values of any fields and any summary functions.
Summaries are calculated for a subset of records from the control’s underlying data source. All the records in this subset have matching values in a column field(s) and row field(s) and these values are identified by column and row headers.
Summary values are displayed within data cells. Consider the following pivot grid which contains two data fields – ‘Qty’ and ‘Payment Amount’:
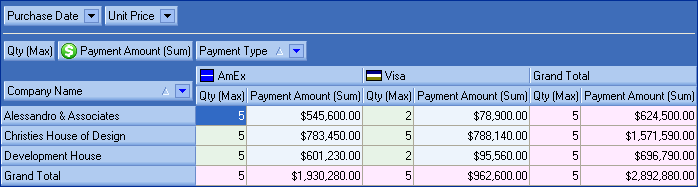
The summary value in the left-topmost cell (5) has been calculated against the ‘Qty’ field for a subset of records which have:
the value ‘Alessandro & Associates’ in the ‘Company Name’ field;
the value ‘AmEx’ in the ‘Payment Type’ field.
The summary value in the bottommost cell in the second column ($1,930,280.00) has been calculated against the ‘Payment Amount’ field for a subset of records which have:
- the value ‘AmEx’ in the ‘Payment Type’ field.
Automatic Summaries
Automatic summaries are calculated against data fields. The type of summary function is determined by the SummaryType property of a corresponding data field. In the image above, the Sum function is calculated against the ‘Payment Amount’ field and the Max function is calculated against the ‘Qty’ field. Refer to the TcxPivotGridSummaryType topic for a complete list of the built-in summary functions and their descriptions.
Note
For data fields that contain string values, the Count, Count of Distinct Values, Min, and Max functions work. For data fields that contain non-numeric values, only the Count and Count of Distinct Values functions work. If any other summary function is used for these data fields the corresponding data cells will display blanks.
Custom Summaries
The main purpose of custom summaries is to give you the ability to calculate summaries manually. So custom summaries can be used to:
calculate a custom summary function;
involve multiple fields in summary calculation;
calculate a summary for particular records (for instance, for the records which match specific criteria).
To enable a custom summary for a specific data field, set the field’s SummaryType property to stCustom and handle the OnCalculateCustomSummary event to provide a custom summary value for each data cell. While handling this event you can use the Records property of the event’s ASummary parameter to determine the indexes of the records that correspond to the data cell and access the relevant data in the underlying data source. Also, you can use the ASummary parameter to access the values calculated using all the built-in summary functions.