ChartView.UpDownBars Property
Provides access to settings used to display up-down bars on a 2-D line or stock chart.
Namespace: DevExpress.Spreadsheet.Charts
Assembly: DevExpress.Spreadsheet.v26.1.Core.dll
Declaration
Property Value
| Type | Description |
|---|---|
| UpDownBarsOptions | An UpDownBarsOptions object containing bar display settings. |
Remarks
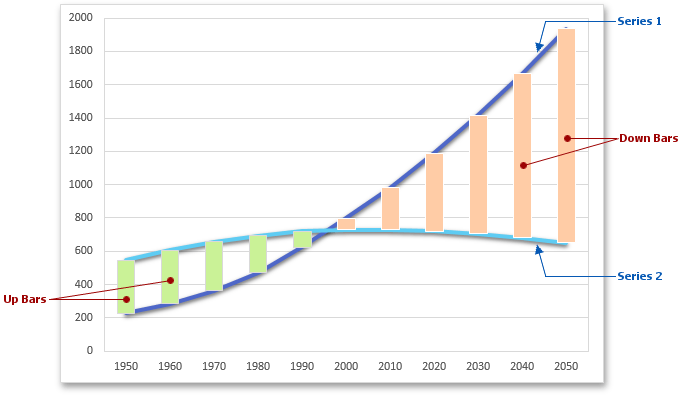
Up-down bars on a two-dimensional line chart are used to emphasize the difference between data points in the first and last series in the data series collection, as shown in the image below (the chart is displayed in Microsoft® Excel®). Up-down bar are not displayed by default. To add them to a 2-D line chart, set the UpDownBarsOptions.Visible property to true. Note that if you try to display up-down bars on a chart that does not support them, an exception occurs.
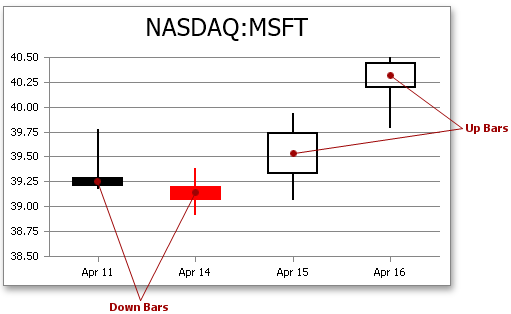
The Open-High-Low-Close and Volume-Open-High-Low-Close stock charts display up-down bars by default. The bottom and top borders of a bar represent the Open and Close prices, respectively. By default, if the stock closes higher than its opening price, the hollow up bar is displayed. And if the stock closes lower than its opening price, the filled down bar is shown.
To specify format options to be applied to up-down bars, use the UpDownBarsOptions.UpBars and UpDownBarsOptions.DownBars properties.
Note
Currently, the SpeadsheetControl does not display up-down bars on a line chart and does not allow you to change the bar properties on a stock chart. However, display settings are loaded and stored in supported formats, and you can modify them programmatically.