ChartView.HighLowLines Property
Provides access to settings used to draw the high-low lines in the two-dimensional line and stock charts.
Namespace: DevExpress.Spreadsheet.Charts
Assembly: DevExpress.Spreadsheet.v26.1.Core.dll
Declaration
Property Value
| Type | Description |
|---|---|
| ChartLineOptions | A ChartLineOptions object containing chart line display options. |
Remarks
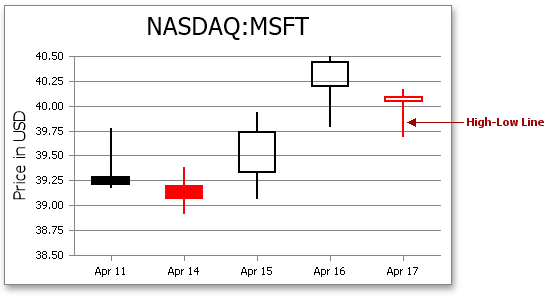
Use the HighLowLines property to display and modify the high-low lines that connect the highest and lowest values in each category. The stock charts display the high-low lines by default, so you can use this property to adjust their appearance, for example, to change the line color or width.
If you try to display high-low lines on a chart that does not support them, an exception occurs.
Note
Currently, the SpeadsheetControl does not display the high-low lines on a line chart and does not allow you to change the line properties on a stock chart. However, display settings are loaded and stored in supported formats, and you can modify them programmatically.