ChartObject.LoadStyle(Stream) Method
Loads a custom style from the specified stream and applies it to the chart. Available only for Excel 2016 charts.
Namespace: DevExpress.Spreadsheet.Charts
Assembly: DevExpress.Spreadsheet.v26.1.Core.dll
Declaration
Parameters
| Name | Type | Description |
|---|---|---|
| stream | Stream | A stream that contains XML data with a chart style definition. |
Remarks
The code sample below applies a custom style to a waterfall chart. The style.xml file contains a definition of a standard style used for histogram and funnel charts.
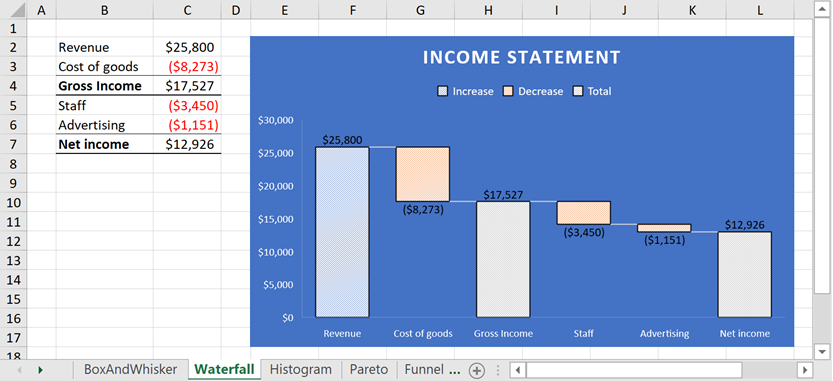
// Create a waterfall chart and specify its location.
Chart chart = worksheet.Charts.Add(ChartType.Waterfall, worksheet["B2:C7"]);
chart.TopLeftCell = worksheet.Cells["E2"];
chart.BottomRightCell = worksheet.Cells["L17"];

// Hide the major gridlines for the value axis.
chart.PrimaryAxes[1].MajorGridlines.Visible = false;

// Specify series options.
var options = chart.Series[0].LayoutOptions.Waterfall;
// Display connector lines.
options.ShowConnectorLines = true;
// Set the third data point as the total.
options.SubtotalDataPoints.Add(2);
// Set the last data point as the total.
options.SubtotalDataPoints.Add(5);

// Load a custom style
// and apply it to the chart.
using (FileStream stream = File.Open(@"CustomStyles\style.xml", FileMode.Open))
    chart.LoadStyle(stream);

// Add the chart title.
chart.Title.Visible = true;
chart.Title.SetValue("Income Statement");
See Also