GridColumnSummary.DisplayFormat Property
Gets or sets the pattern used to format the summary value. This is a bindable property.
Namespace: DevExpress.Maui.DataGrid
Assembly: DevExpress.Maui.DataGrid.dll
NuGet Package: DevExpress.Maui.DataGrid
Declaration
public string DisplayFormat { get; set; }Property Value
| Type | Description |
|---|---|
| String | A string that specifies the pattern used to format the summary value. |
Remarks
Use the DisplayFormat property to format the summary value and accompany it with additional text. A pattern should have the following structure:
<custom static text>{0:<format specifier<precision specifier>>}<custom static text>
- {0}—the summary value’s placeholder.
- format specifier—the format type (currency, scientific, etc).
- precision specifier—the number of characters displayed after the decimal point.
For example, to display currency values, set the DisplayFormat property to ‘Total: {0:c2}‘. If the summary value is 123, its formatted equivalent is Total: $123.00.
If you do not specify the summary’s display format, the grid uses the following default formats:
| Summary Type | Total Summary Format | Group Summary Format |
|---|---|---|
| Average | AVG={0:columnDisplayFormat} | summaryFieldName: AVG={0:columnDisplayFormat} |
| Count | {0} | {0} |
| Min | MIN={0:columnDisplayFormat} | summaryFieldName: MIN={0:columnDisplayFormat} |
| Max | MAX={0:columnDisplayFormat} | summaryFieldName: MAX={0:columnDisplayFormat} |
| Sum | SUM={0:columnDisplayFormat} | summaryFieldName: SUM={0:columnDisplayFormat} |
Example
The following example uses predefined aggregate functions (Max and Sum) and a custom rule to calculate group and total summaries for a grid that displays orders grouped by dates.
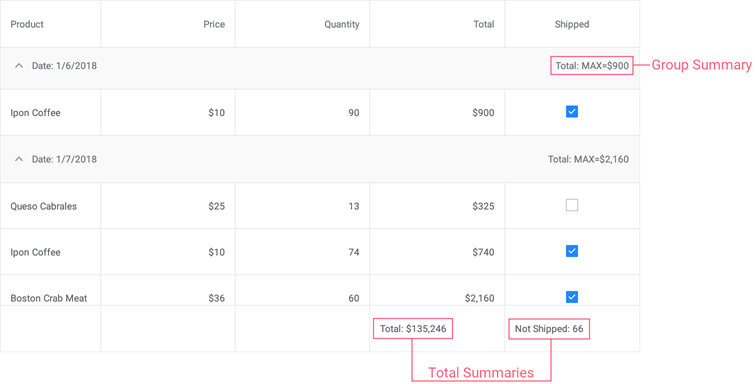
Set up the following summaries:
- A group summary to display the maximum Total value for each group of orders.
- A total summary to calculate the sum of values in the Total column.
- A custom total summary to count the number of orders with the false value in the Shipped column.
<dxg:DataGridView x:Name="grid" ItemsSource="{Binding Orders}"
                  CustomSummary="grid_CalculateCustomSummary">
    <!-- ... -->
    <dxg:DataGridView.GroupSummaries>
        <dxg:GridColumnSummary FieldName="Total" Type="Max"/>
    </dxg:DataGridView.GroupSummaries>

    <dxg:DataGridView.TotalSummaries>
        <dxg:GridColumnSummary FieldName="Total" Type="Sum"
                               DisplayFormat="Total: {0:C0}"/>
        <dxg:GridColumnSummary FieldName="Shipped" Type="Custom"
                               DisplayFormat="Not Shipped: {0}"/>
    </dxg:DataGridView.TotalSummaries>
</dxg:DataGridView>
int count;
// ...

private void grid_CustomSummary(object sender, DevExpress.Maui.DataGrid.CustomSummaryEventArgs e) {
    if (e.FieldName.ToString() == "Shipped")
        if (e.IsTotalSummary) {
            if (e.SummaryProcess == DevExpress.Maui.Core.DataSummaryProcess.Start) {
                count = 0;
            }
            if (e.SummaryProcess == DevExpress.Maui.Core.DataSummaryProcess.Calculate) {
                if (!(bool)e.Value)
                    count++;
                e.TotalValue = count;
            }
        }
}