TrendlineCollection Interface
A collection that stores the Trendline objects for the specified series.
Namespace: DevExpress.Spreadsheet.Charts
Assembly: DevExpress.Spreadsheet.v23.2.Core.dll
NuGet Package: DevExpress.Spreadsheet.Core
Declaration
public interface TrendlineCollection :
    ISimpleCollection<Trendline>,
    IEnumerable<Trendline>,
    IEnumerable,
ICollectionRelated API Members
The following members return TrendlineCollection objects:
Remarks
Use the Series.Trendlines property to obtain TrendlineCollection.
Use the TrendlineCollection.Add method to create a new trendline and add it to the series.
Use the indexed notation to access a Trendline object. The index number specifies the order in which the trendlines are added to the series.
Example
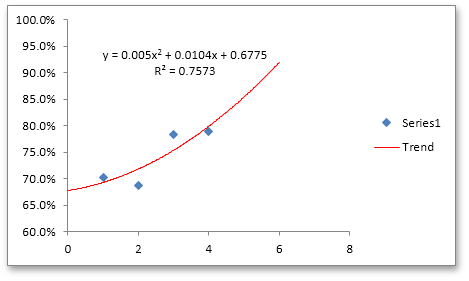
The following code uses the TrendlineCollection.Add method to display a trendline of the ChartTrendlineType.Polynomial type and customize it.
Worksheet worksheet = workbook.Worksheets["chartTask3"];
workbook.Worksheets.ActiveWorksheet = worksheet;

// Create a chart and specify its location.
Chart chart = worksheet.Charts.Add(ChartType.ScatterMarkers);
chart.SelectData(worksheet["C2:F3"], ChartDataDirection.Row);
chart.TopLeftCell = worksheet.Cells["H2"];
chart.BottomRightCell = worksheet.Cells["N14"];

// Set the minimum and maximum values for the chart value axis.
Axis axis = chart.PrimaryAxes[1];
axis.Scaling.AutoMax = false;
axis.Scaling.AutoMin = false;
axis.Scaling.Min = 0.6;
axis.Scaling.Max = 1.0;
chart.PrimaryAxes[1].MajorGridlines.Visible = false;

// Display a polynomial trendline.
chart.Series[0].Trendlines.Add(ChartTrendlineType.Polynomial);

// Customize the trendline.
Trendline tline = chart.Series[0].Trendlines[0];
tline.DisplayEquation = true;
tline.CustomName = "Trend";
tline.DisplayRSquare = true;
tline.Backward = 1;
tline.Forward = 2;
tline.Outline.SetSolidFill(Color.Red);