DxChart<T>.Data Property
Specifies a data source.
Namespace: DevExpress.Blazor
Assembly: DevExpress.Blazor.v20.2.dll
NuGet Package: DevExpress.Blazor
Declaration
[Parameter]
public IEnumerable<T> Data { get; set; }
Property Value
| Type | Description |
|---|---|
| IEnumerable<T> | A data source. |
Remarks
The Chart component supports a data source that contains table-based data. Refer to our GitHub repository for a sample data source.
Use the DxChartCommonSeries<T, TGroup, TValue, TArgument> object to access chart series settings.
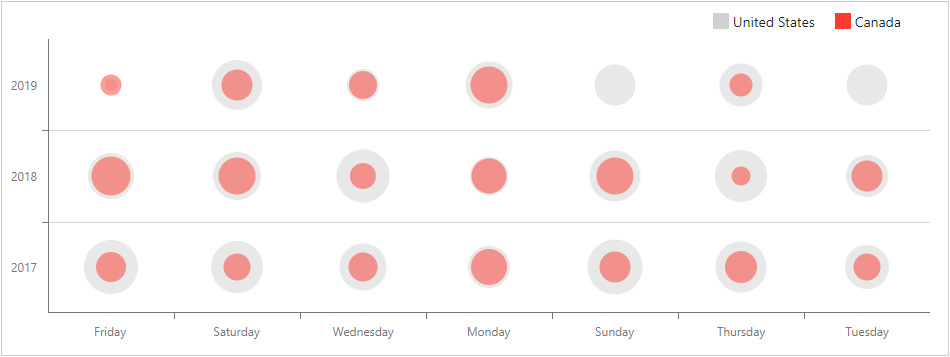
<DxChart Data="@ChartsData">
    <DxChartCommonSeries
        NameField="@((SaleInfo s) => s.Country)"
        Filter="@(s => s.Region == "North America")"
        ArgumentField="@(s => s.Date.DayOfWeek.ToString())"
        ValueField="@(s => s.Date.Year)"
        SeriesType="ChartSeriesType.Bubble">
    </DxChartCommonSeries>
    ...
</DxChart>
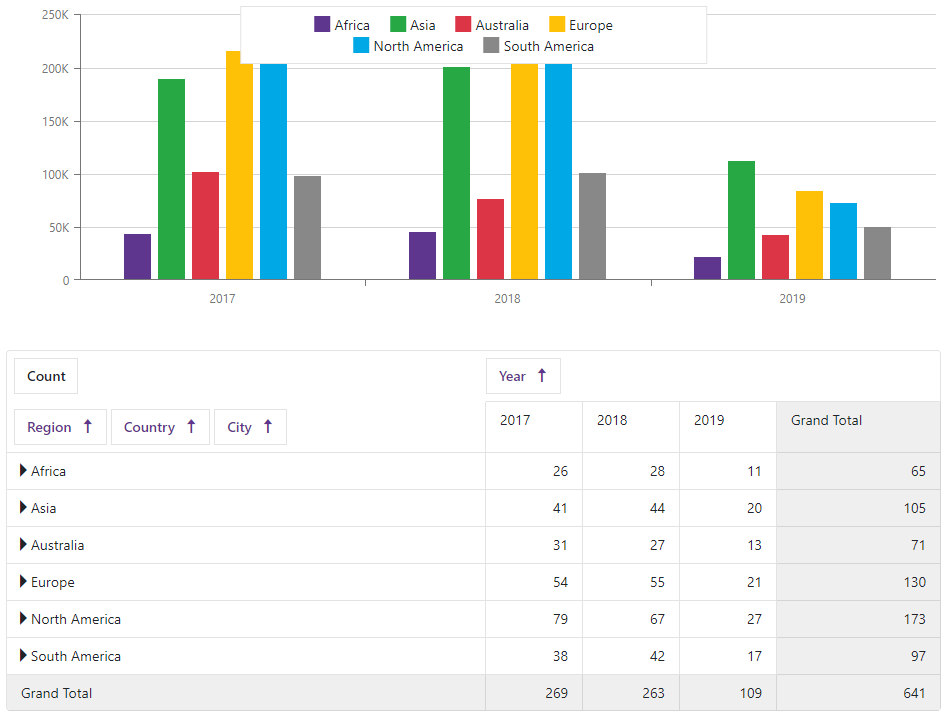
You can also link the Chart to the DxPivotGrid<T> component. Create a DxPivotGridDataProvider<T> object and set the Chart’s Data property to the provider’s ChartDataSource property value. Refer to the Visualize Pivot Grid Data section for more information.
<DxChart Data="@(PivotGridDataProvider.ChartDataSource)">
    <DxChartCommonSeries NameField="@((IChartDataItem s) => s.SeriesName)"
                         ArgumentField="@(s => s.Argument)"
                         ValueField="@(s => s.Value)"
                         SeriesType="ChartSeriesType.Bar" />
</DxChart>

<DxPivotGrid Data="@(PivotGridDataProvider.PivotGridDataSource)">
    <DxPivotGridField Field="@nameof(SaleInfo.Region)" SortOrder="PivotGridSortOrder.Ascending"
        Area="PivotGridFieldArea.Row"></DxPivotGridField>
    <DxPivotGridField Field="@nameof(SaleInfo.Country)" Area="PivotGridFieldArea.Row"></DxPivotGridField>
    <DxPivotGridField Field="@nameof(SaleInfo.City)" Area="PivotGridFieldArea.Row"></DxPivotGridField>
    <DxPivotGridField Field="@nameof(SaleInfo.Date)" GroupInterval="PivotGridGroupInterval.Year"
        Area="PivotGridFieldArea.Column" Caption="Year"> </DxPivotGridField>
    <DxPivotGridField Field="@nameof(SaleInfo.OrderId)" Caption="Count" Area="PivotGridFieldArea.Data"
        SummaryType="PivotGridSummaryType.Count"> </DxPivotGridField>
</DxPivotGrid>

@code {
    DxPivotGridDataProvider<SaleInfo> PivotGridDataProvider = DxPivotGridDataProvider<SaleInfo>.Create(Sales.Load());
}
The Chart shows data from the Pivot Grid’s lowest expanded level. The Chart is updated when a user expands or collapses rows/columns in the Pivot Grid.
Online Demos
Pivot Grid - Chart Integration