DxChartCandlestickSeries<T, TArgument, TValue> Class
Defines a candlestick series.
Namespace: DevExpress.Blazor
Assembly: DevExpress.Blazor.v20.2.dll
NuGet Package: DevExpress.Blazor
Declaration
public class DxChartCandlestickSeries<T, TArgument, TValue> :
    DxChartSeries<T, TArgument, TValue, ChartCandlestickSeriesModel<T, TArgument, TValue>>
Type Parameters
| Name | Description |
|---|---|
| T | The type of data. |
| TArgument | The type of series arguments. |
| TValue | The type of series values. |
Remarks
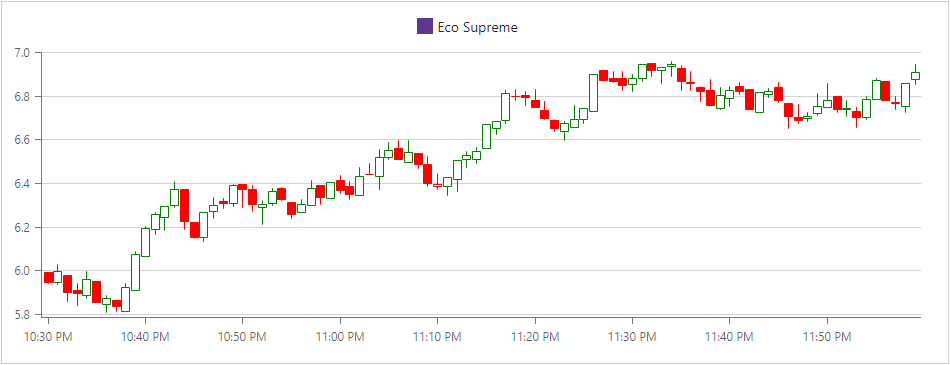
Use a candlestick series to display the Open-High-Low-Close stock price data as candles. A set of values with the same associated argument is aggregated into one point. The first value in the set is considered to be Open Value, the last value is Close Value, maximum and minimum values represent High and Low values.
Each series point consists of a rectangle (body) whose bottom and topmost values correspond to the open and close price of a stock. A vertical line displays the high and low price for the stock. If the stock closes higher than its open price, the corresponding body is not filled. If the stock closes lower than its open price, the corresponding body is filled.
<DxChart Data="@StockData">
    <DxChartLegend Position="RelativePosition.Outside" />
    <DxChartCandlestickSeries ValueField="@((BargainDataPoint i) => i.Price)"
                              ArgumentField="@(i => new DateTime(i.DateTimeStamp.Year,
                                            i.DateTimeStamp.Month, i.DateTimeStamp.Day,
                                            i.DateTimeStamp.Hour, i.DateTimeStamp.Minute, 0) )"
                              Name="Eco Supreme" />
    <DxChartTooltip>
        @context.GetFinancialPoint().Render((financialPoint) =>
            @<div class="p-3">
                <p>Open: <span>@($"{financialPoint.OpenValue: 0.00}")</span></p>
                <p>Close: <span>@($"{financialPoint.CloseValue: 0.00}")</span></p>
                <p>High: <span>@($"{financialPoint.HighValue: 0.00}") </span></p>
                <p>Low: <span>@($"{financialPoint.LowValue: 0.00}") </span></p>
            </div>
            )
    </DxChartTooltip>
</DxChart>
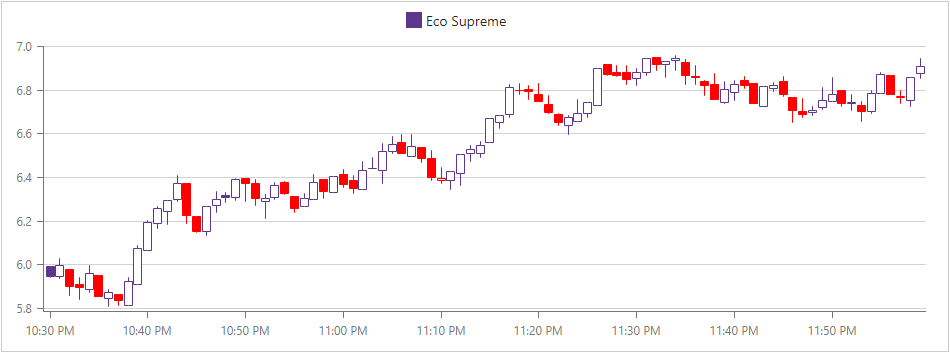
To customize point appearance, use the CustomizeSeriesPoint event:
<DxChart Data="@StockData" CustomizeSeriesPoint="PreparePointColor">
    <DxChartLegend Position="RelativePosition.Outside" />
    <DxChartCandlestickSeries ValueField="@((BargainDataPoint i) => i.Price)"
                              ArgumentField="@(i => new DateTime(i.DateTimeStamp.Year,
                                            i.DateTimeStamp.Month, i.DateTimeStamp.Day,
                                            i.DateTimeStamp.Hour, i.DateTimeStamp.Minute, 0) )"
                              Name="Eco Supreme" />
    <DxChartTooltip>
        @context.GetFinancialPoint().Render((financialPoint) =>
            @<div class="p-3">
                <p>Open: <span>@($"{financialPoint.OpenValue: 0.00}")</span></p>
                <p>Close: <span>@($"{financialPoint.CloseValue: 0.00}")</span></p>
                <p>High: <span>@($"{financialPoint.HighValue: 0.00}") </span></p>
                <p>Low: <span>@($"{financialPoint.LowValue: 0.00}") </span></p>
            </div>
            )
    </DxChartTooltip>
</DxChart>

@code {
    // ...
    protected void PreparePointColor(ChartSeriesPointCustomizationSettings pointSettings) {
        double openValue = (double)((ChartFinancialSeriesPoint)pointSettings.Point).OpenValue;
        double closeValue = (double)((ChartFinancialSeriesPoint)pointSettings.Point).CloseValue;
        if (openValue > closeValue)
            pointSettings.PointAppearance.Color = System.Drawing.Color.Red;
        else if (openValue < closeValue)
            pointSettings.PointAppearance.Color = System.Drawing.Color.Green;
    }
}
The image below shows the results: