ChartSeriesLabelModel.Visible Property
Specifies the label visibility state.
Namespace: DevExpress.Blazor
Assembly: DevExpress.Blazor.v20.2.dll
NuGet Package: DevExpress.Blazor
Declaration
[DefaultValue(false)]
public bool Visible { get; set; }
Property Value
| Type | Default | Description |
|---|---|---|
| Boolean | **false** | true to display the series label; otherwise, false. |
Remarks
The PointLabel property returns instances of the ChartSeriesLabelModel class. Use this property in the CustomizeSeriesPoint event handler to specify the label color, position, connector, and visibility.
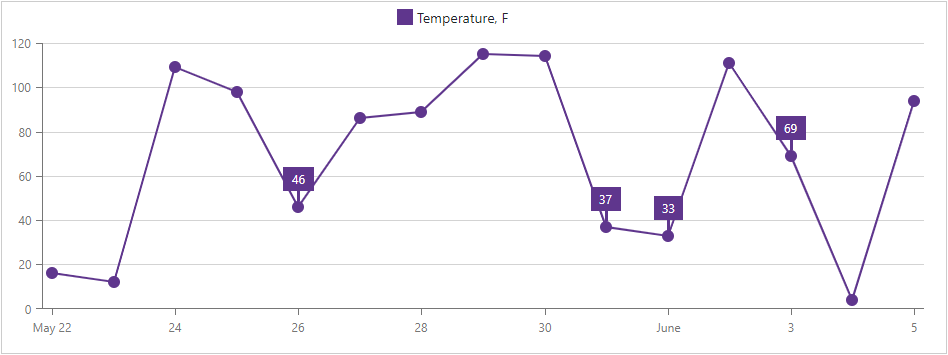
The following example demonstrates how to:
- use the DxChartSeriesLabel component to specify the position of all labels;
- use the DxChartSeriesLabelConnector component to customize connectors between data points and labels;
- handle the CustomizeSeriesPoint event to show only labels whose values are between 25 and 75.
@inject WeatherForecastService ForecastService

<DxChart Data="@ChartData" CustomizeSeriesPoint="@PreparePointLabel">
    <DxChartLineSeries AggregationMethod="@(i => (int)i.Average())"
                       ValueField="@((WeatherForecast i) => i.TemperatureF)"
                       ArgumentField="@(i => i.Date.Date)"
                       Name="Temperature, F">
        <DxChartSeriesLabel Position="RelativePosition.Outside">
            <DxChartSeriesLabelConnector Visible="true" Width="3" />
        </DxChartSeriesLabel>
    </DxChartLineSeries>
</DxChart>

@code {
    WeatherForecast[] ChartData;

    protected override async Task OnInitializedAsync() {
        ChartData = await ForecastService.GetForecastAsync();
    }

    protected void PreparePointLabel(ChartSeriesPointCustomizationSettings pointSettings) {
        double value = (double)pointSettings.Point.Value;
        if (value > 25 && value < 75)
            pointSettings.PointLabel.Visible = true;
    }
}
See Also